|
|||||

|
|||||
|
|||||
|
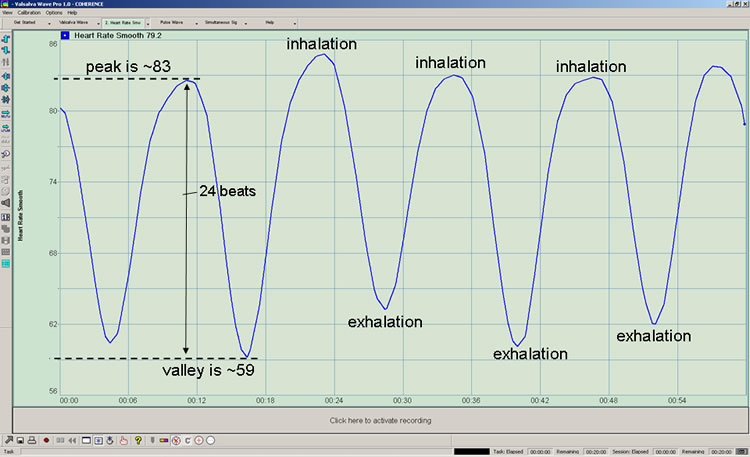
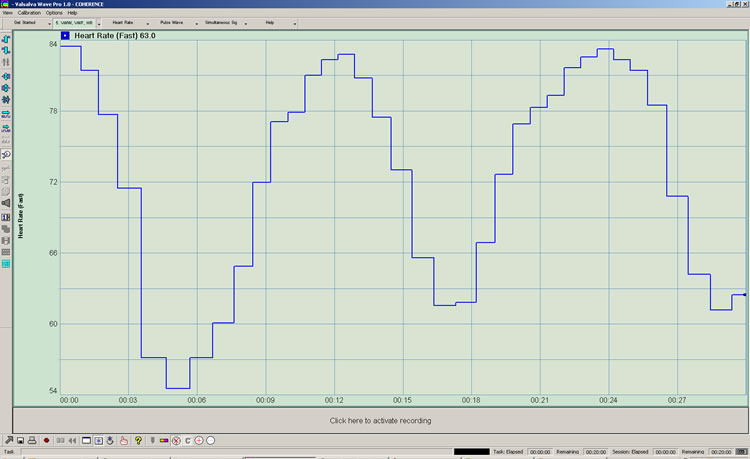
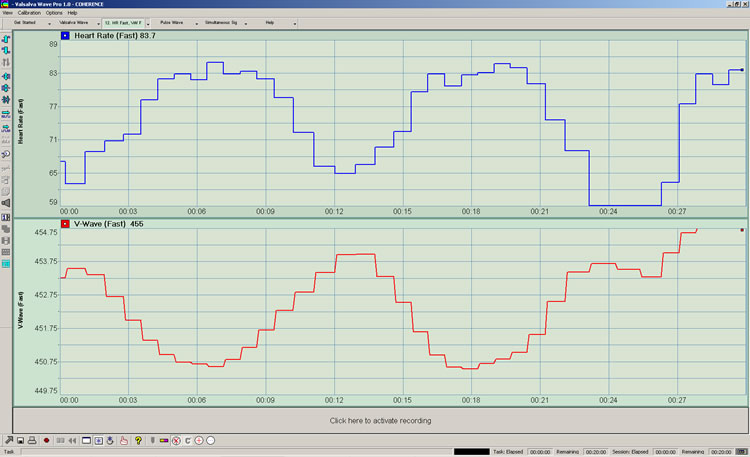
While we tend to think of the "normal" heart beat rate as being "72 beats per minute", in actuality the heart beat rate is not and should not be constant. In fact, the contemporary understanding is that the degree to which the heart beat varies is a key indicator of health and well being. Conversely, the degree to which it does not vary is a key indicator of health risk. The "72 beats per minute" that we are familiar with is the normal average heart beat rate. In other words, if we were to measure the heart beat rate (in beats per minute) every second for 1 minute, then average the 60 measurements, the average would be in the range of 72 beats per minute. If instead of averaging the 60 measurements, we plot them on a graph, we are able to see how the heart beat rate varies in time. The general term for this "variation" is "Heart Rate Variability" or simply "HRV", but for purposes of analysis we refer to it as "HRV amplitude". It is also known as "HR max" minus "HR min". In the above figure, we see heart rate rising during inhalation and falling during exhalation. It varies between approximately 77 beats per minute and 55 beats per minute. If we subtract 55 from 77 we arrive at a Heart Rate Variability "amplitude" of 22 beats. We don't have to look at each cycle to determine its amplitude because this instrument is capable of measuring amplitude for us, both short and long term. You can find these functions, "HRV Amplitude", and "HRV Amp Av", under this tab. It is generally understood that the HRV phenomenon is an outcome of autonomic nervous system regulation of blood flow and pressure, blood pressure being sensed by specialized neurons known as "baroreceptors". We also know that heart rate varies with respiration. This phenomenon goes by the name "Respiratory Sinus Arrhythmia" (RSA), the name connoting that the heart beat rate varies with respiration in a "sinusoidal" "arrhythmic" fashion, resembling a wave (however, the HRV cycle is not an actual wave, it is an abstraction). Instead of "RSA" we're beginning to use the term "Respiratory Sinus Rhythmia" - the correct understanding being that it is the absence of variation in heart beat rate due to the absence of effective respiration that is "arrhythmic" and pathological. The current theory is that respiratory changes in heart rate are an outcome of autonomic nervous system regulation of the Valsalva Wave, an actual blood wave that rises when we exhale and falls when we inhale. Heart rate and Valsalva Wave cycles tend to be 180 degrees out of phase during resonance. The Heart Rate Series Please note that these particular views are representative of what you will see on each of the screens and do not represent a specific training recommendation. Independently numbered graphs do not relate to each other in time or amplitude. Valsalva Wave metrics are "red" (connoting blood) and heart rate metrics are "blue" throughout. 1. Heart Rate (Fast): This is the most basic Heart Rate signal derived by measuring the inter-beat interval of the AC Pulsewave. It is called "Fast" because its processing and presentation incur as little delay as possible.
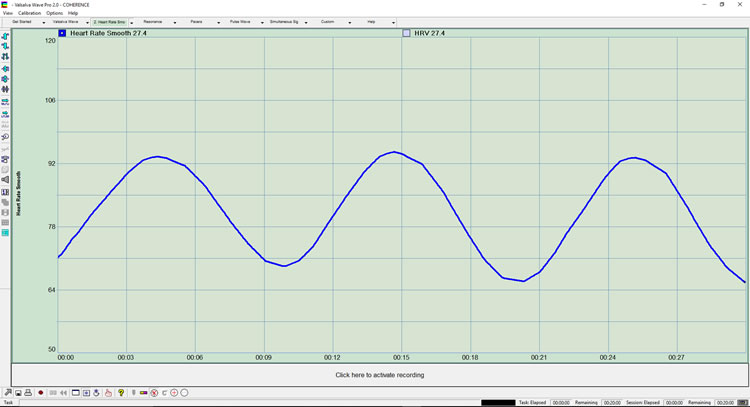
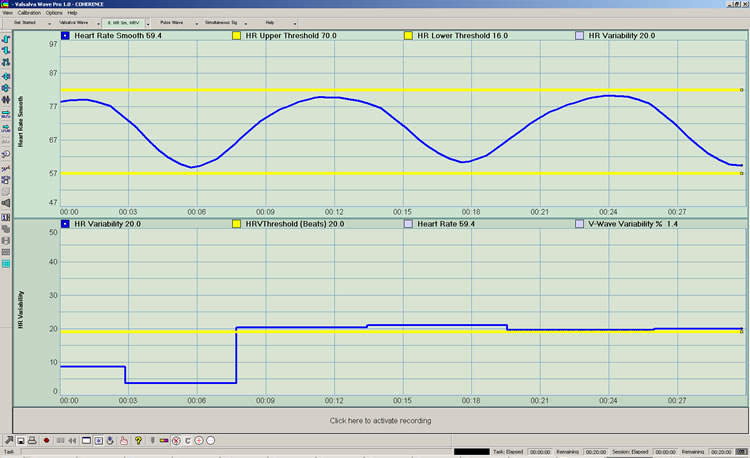
2. Heart Rate (Smooth): The Smooth Heart Rate is derived by averaging the Fast Heart Rate. Smooth HR is shown here with visual thresholding. HR Variability is also indicated.
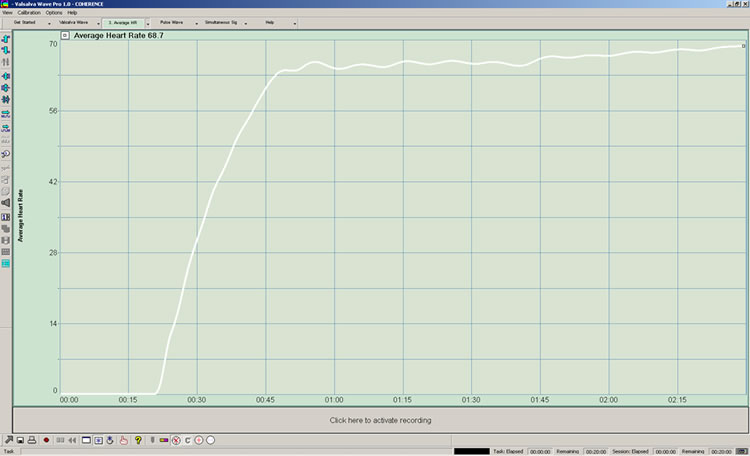
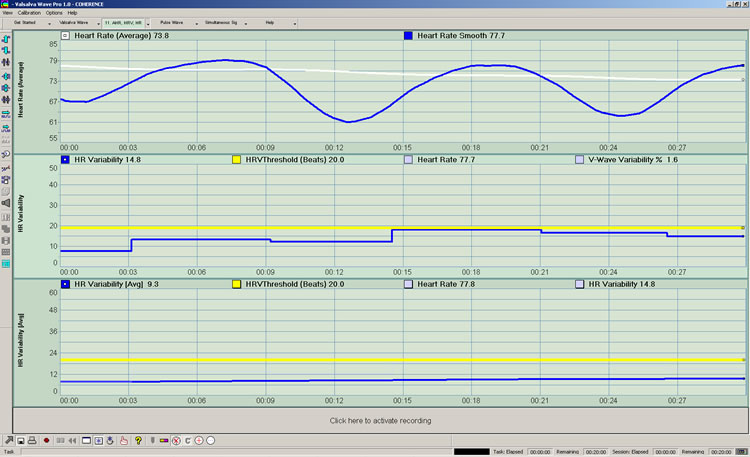
3. Heart Rate (Average): This screen simply shows the long term average Heart Rate. Because it is a longer term average, it takes a number of seconds for it to begin to rise.
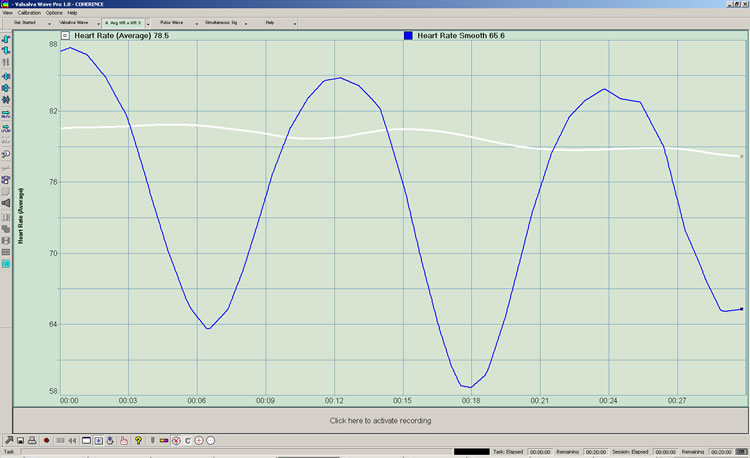
4. Heart Rate (Average) AND Heart Rate (Smooth): This screen shows the Smooth Heart Rate and the Average Heart Rate simultaneously. They share the same Y-axis.
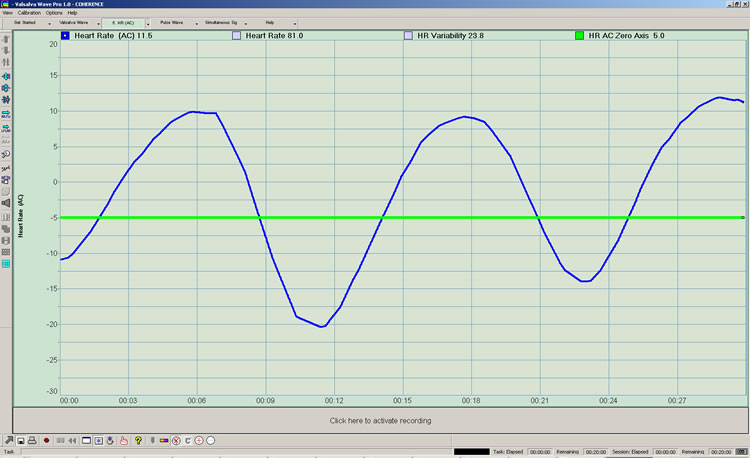
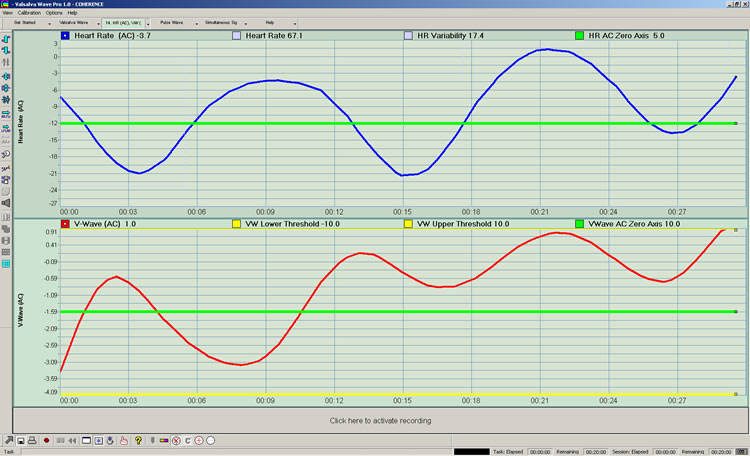
5. Heart Rate (AC): The AC Heart Rate varies around an X axis of zero, the average heart rate being subtracted from the "AC" variation. It is useful when we are interested in observing variability. The green line is the zero X axis around which the AC signal varies.
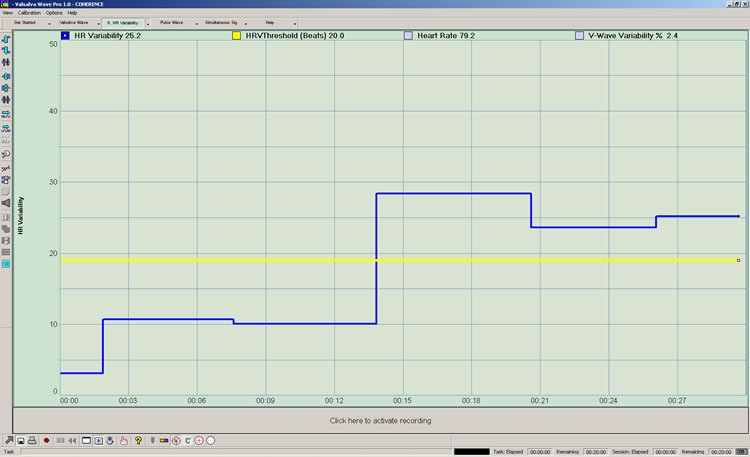
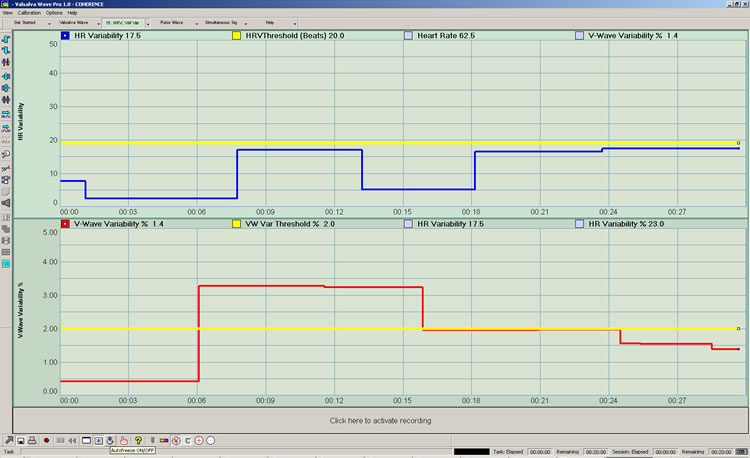
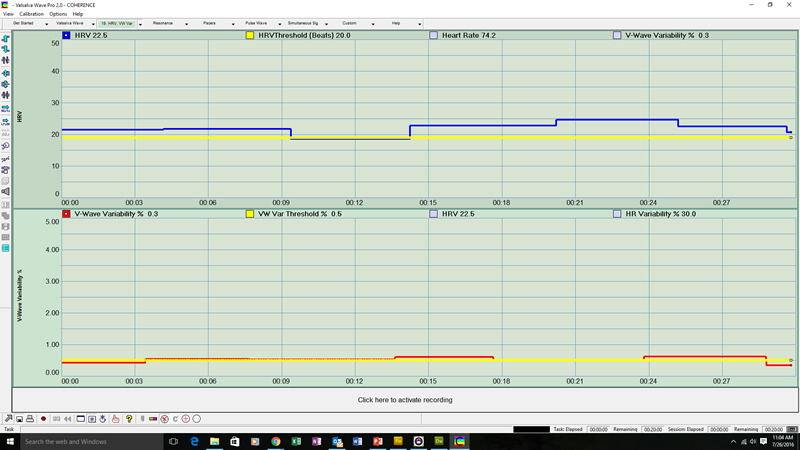
6. Heart Rate Variability: This screen measures the height of the heart rate variability cycle. It is the same as HR(max) minus HR(min). It is responsive to breath-to-breath changes in Heart Rate. With Release 09_01_10, visual thresholding is provided. This graph shows the threshold set to the default value of 20 beats. Heart rate and HR Variability% are indicated.
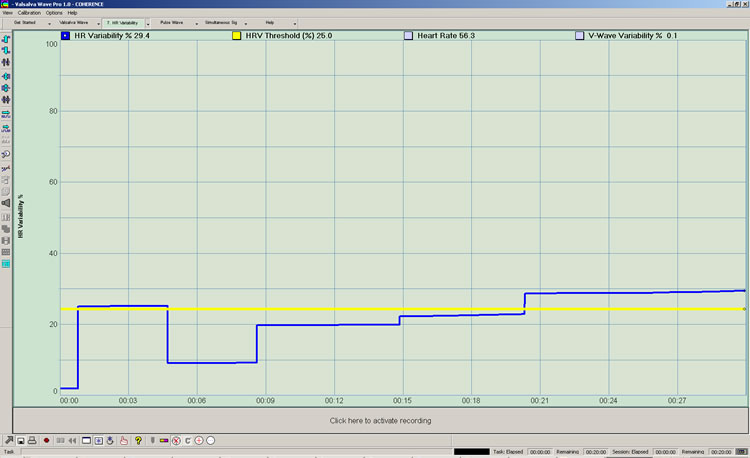
7. Heart Rate Variability %: Presents the variability of the heart rate as a percentage of Average Heart Rate. Thresholding is provided as a percentage of heart rate. The graph shows the threshold set to 25%. If the average HR is 72 beats, 25% is 18 beats. Current Heart Rate and Current V-Wave Variability% are also indicated.
8. Heart Rate (Smooth), Heart Rate Variability: Presents simultaneous Heart Rate and Heart Rate Variability screens.
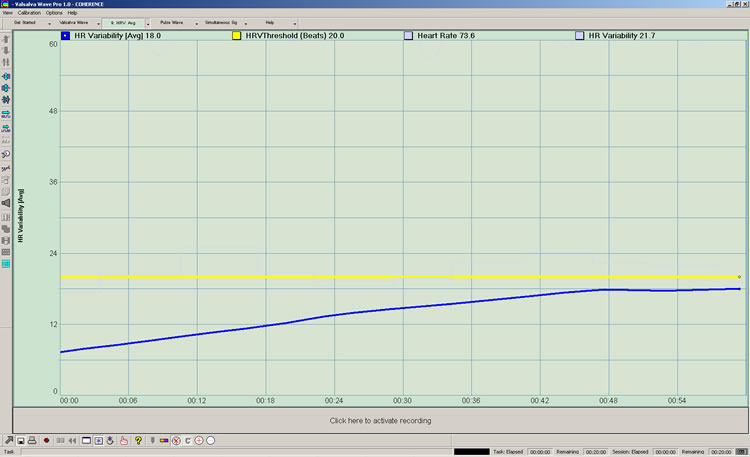
9. Heart Rate Variability Average: This screen presents a longer term average of Heart Rate Variability. It is useful for gauging variability over 10s of seconds. With Release 09_01_10, thresholding is provided. Current Heart Rate and current Heart Rate Variability are also indicated.
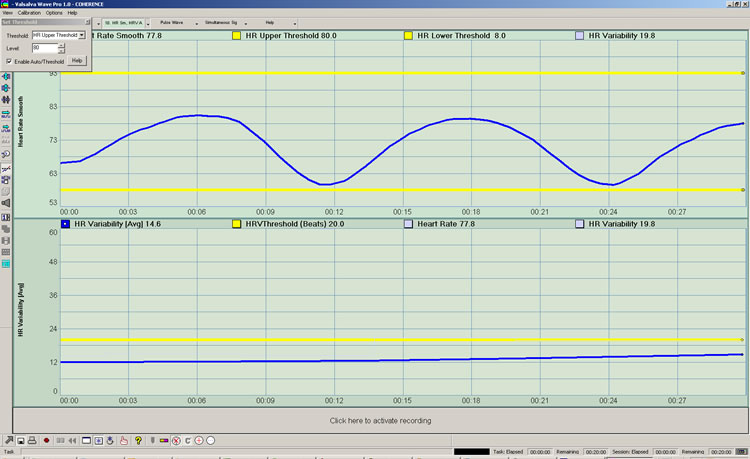
10. Heart Rate Smooth, Heart Rate Variability (Average): Simultaneous presentation of Heart Rate (Smooth) and Heart Rate Variability (Average) graphs.
11. Heart Rate (Average) AND Heart Rate (Smooth), Heart Rate Variability, Heart Rate Variability (Average):
12. Heart Rate (Fast) AND Valsalva Wave (Fast):
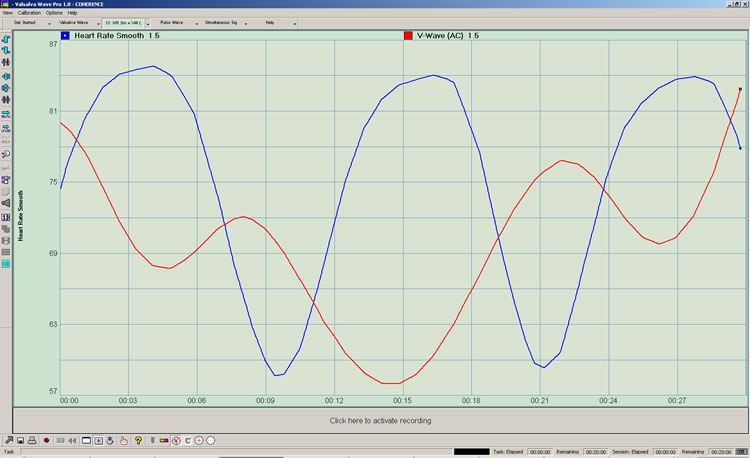
13. Heart Rate Smooth AND Valsalva Wave (AC): This is the same presentation that you find under Valsalva Wave #17 except that here the Y-axis is that of the Heart Rate. Valsalva Wave timing is relevant; Valsalva Wave variability or amplitude is not.
14. Heart Rate (AC), Valsalva Wave (AC): This sceen presents both Heart Rate and Valsalva Wave simultaneously on different graphs. Here they each have their own Y axis and are accurate in terms of both time and amplitude. 15. Heart Rate Variability, Valsalva Wave Variability (%): Simultaneous views of and and Heart Rate variability as a percentage of average heart rate and Valsalva Wave variability as a percentage of average blood volume.
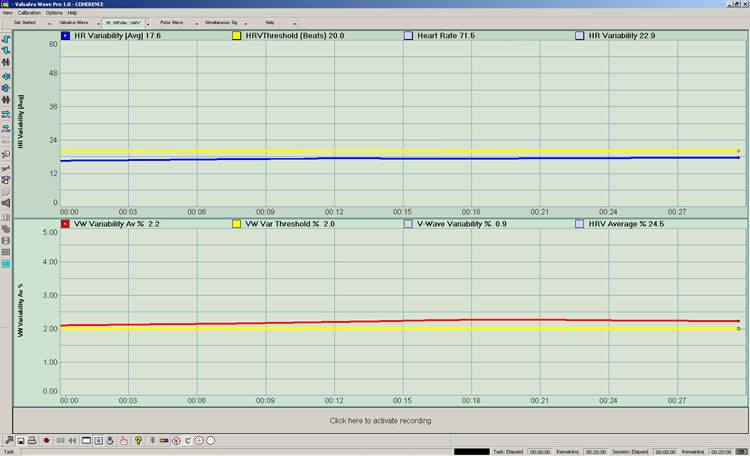
16. Heart Rate Variability (Average), Valsalva Wave Variability Average %: Simultaneous views of the Heart Rate Variability longer term average and Valsalva Wave Variability Average %.
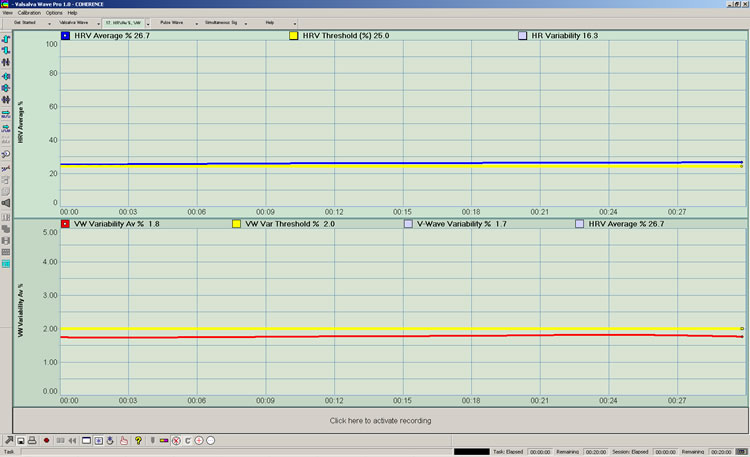
17. Heart Rate Variability (Average %), Valsalva Wave Variability (Average %): Simultaneous views of the Heart Rate Variability longer term average as a percentage of average heart beat rate and Valsalva Wave Variability longer term average as a percentage of blood volume.
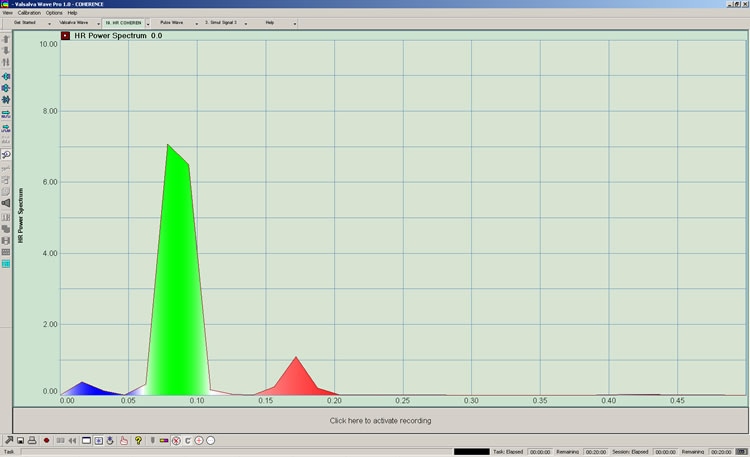
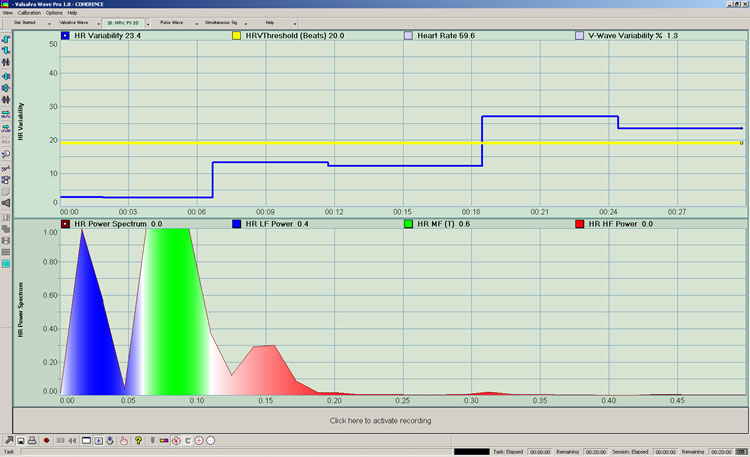
18. Heart Rate Power Spectrum (2D): This screen presents the 2 dimensional Heart Rate "power spectrum". Heart Rate power spectrum tells us the frequency makeup of the heart rate variability cycle. It is divided into 3 bands. See Get Started - Heart Rate Metrics for details of bands. It is generally understood that spectrum to the left of the green band (blue) is associated with slower sympathetic function. Spectrum to the right of the green band (red) is associated with relatively more rapid parasympathetic function. The green band is generally understood to represent equal sympathetic and parasympathetic emphasis, where spectral contribution of sympathetic and parasympathetic systems is similar in both frequency and power.
19. Heart Rate Variability, Valsalva Wave Variability (%):
20. Heart Rate Variability, Heart Rate Power Spectrum (2D): This screen depcits Heart Rate Variability and 2D Power Spectrum.
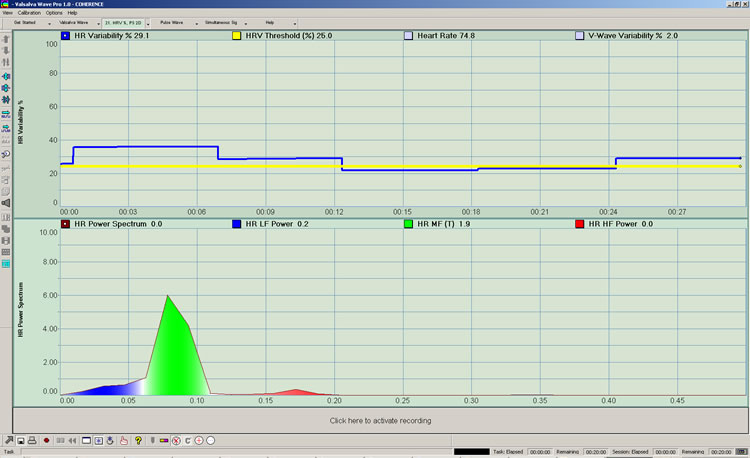
21. Heart Rate Variability (%), Heart Rate Power Spectrum (2D): This screen depicts Heart Rate Variability as a percentate of average heart rate and the two dimensional Heart Rate power spectrum.
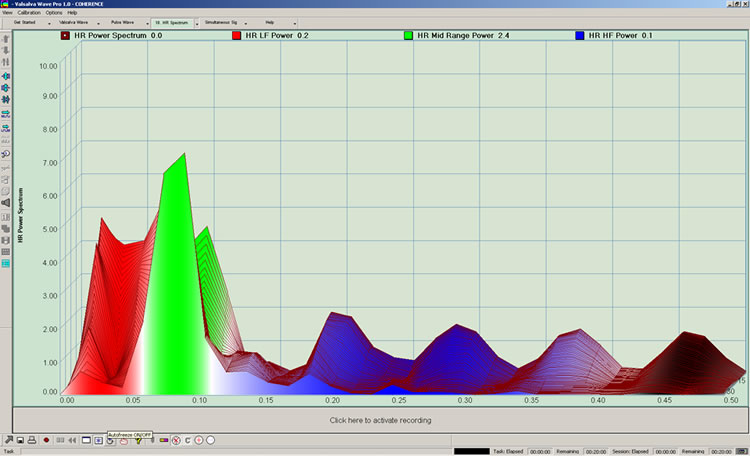
22. Heart Rate Power Spectrum (3D): This screen presents three dimensional Heart Rate power spectrum. It allows us to see how Heart Rate power spectrum varies in time.
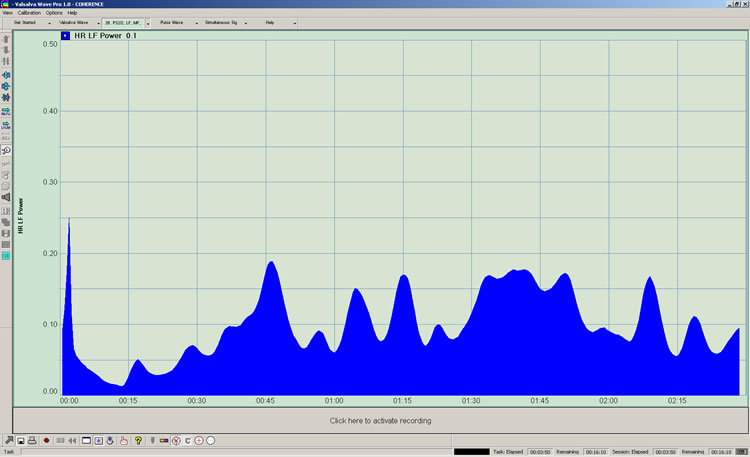
23. Heart Rate Low Frequency Power (0-.06Hz): Power of the low frequency component only as it varies in time. The low frequency component correlates highly with sympathetic activity. This screen presents a "real time" view of low frequency power level and is not cumulative. There is correlation in time between views 23, 24, and 25.
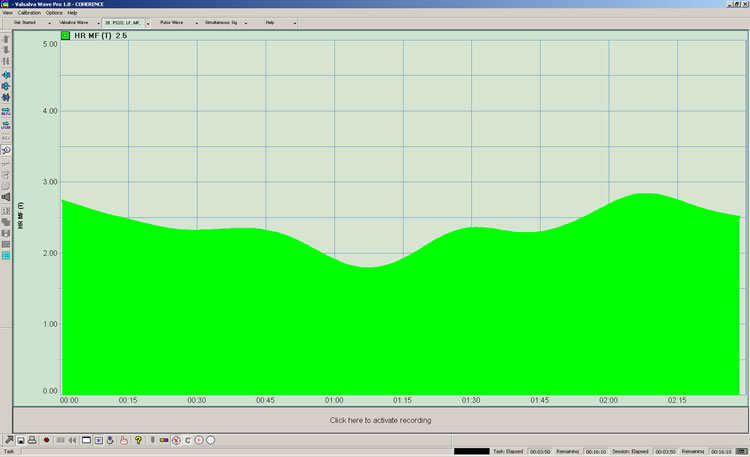
24. Heart Rate Mid-Frequency (.06-.11Hz): Power of the mid frequency component only as it varies in time. The mid-frequency component correlates highly with sympathetic/parasympathetic balance. This screen presents a "real time" view of mid-frequency power level and is not cumulative. There is correlation in time between views 23, 24, and 25. The name "HR MF (T)" stands for Heart Rate Mid-Frequency (Target) as this band is the "target band".
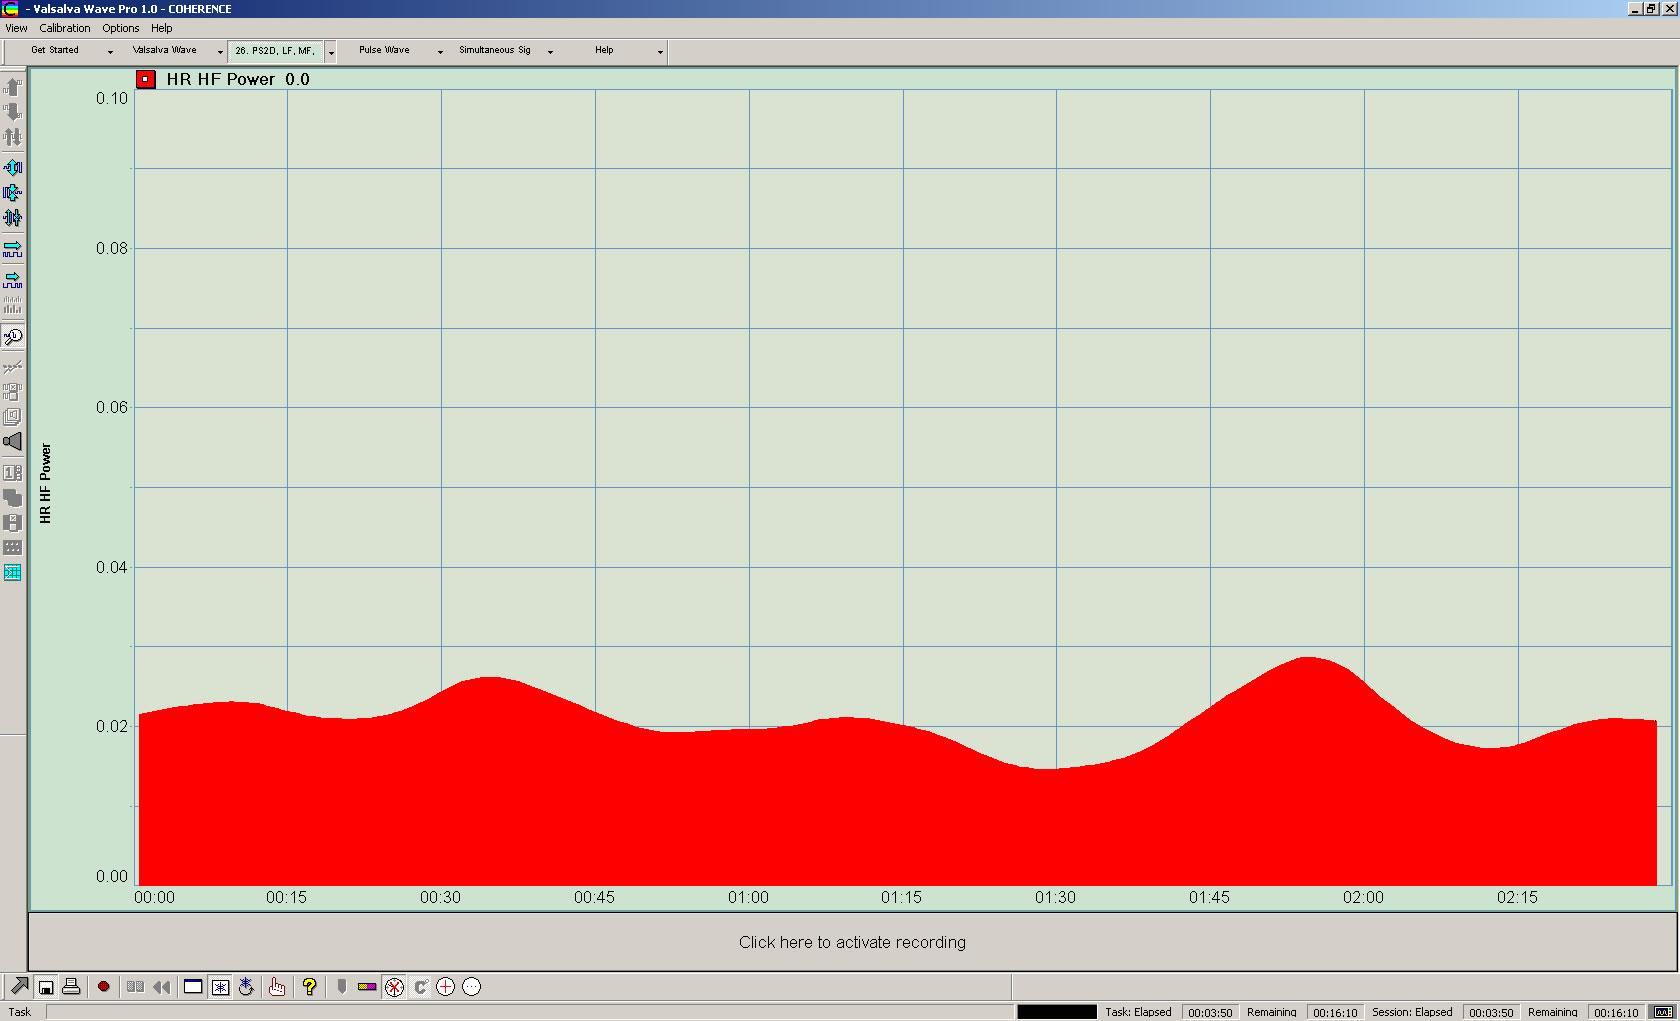
25. Heart Rate High Frequency (.11-.4Hz): Power of the high frequency component only as it varies in time. The high-frequency component correlates highly with parasympathetic activity. This screen presents a "real time" view of high frequency power level and is not cumulative. There is correlation in time between views 25, 26, and 27.
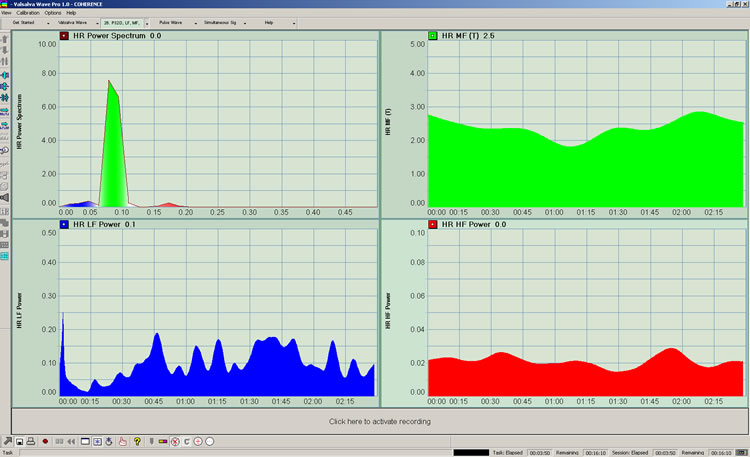
25. Heart Rate Power Spectrum (2D), Lo-Frequency, Mid-Frequency, and High Frequency Power: This presents a combined view. There is correlation in time between Low Frequency, Mid-Frequency, and High Frequency views. The 2-D Power Spectrum (upper left quadrant) is cumulative.
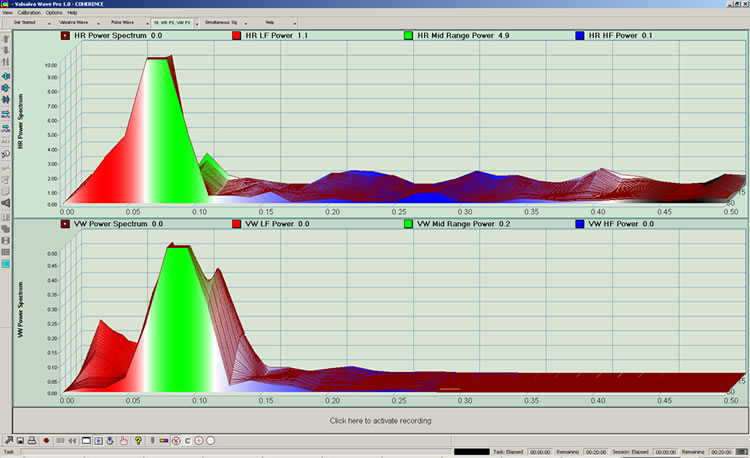
27. Heart Rate Power Spectrum (3D), Valsalva Wave Power Spectrum (3D): This screen presents simultaneous views of Heart Rate power spectrum and Valsalva Wave power spectrum as they occur in time.
Copyright 2016 COHERENCE LLC(V2.0 July 2016) |
||||