|
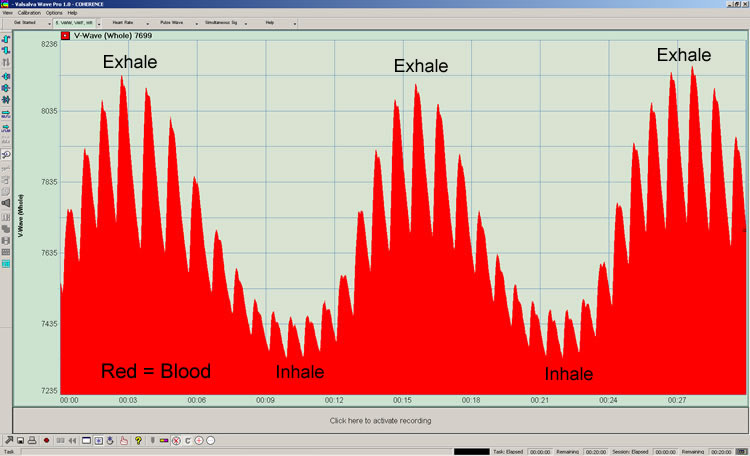
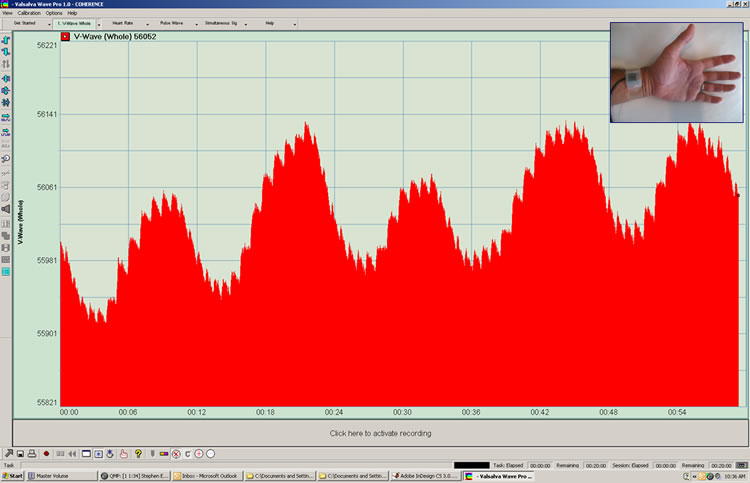
Purchase July 2016 The Valsalva Wave is an actual "blood wave" that occurs in the circulatory system as a consequence of respiration. The wave is generated by the "thoracic pump" and facilitated by the autonomic nervous system, including actions of the heart. The "red" in the graph below is the actual profile of the blood, in this case as monitored in the right ear lobe.
The Whole Valsalva Wave While Breathing "Coherently" Each time we inhale a large volume of blood is drawn from the extremities through the venous system and right heart, into the lungs where it fills the dense pulmonary capillary bed. There it meets with incoming air facilitating the exchange of carbon dioxide for oxygen. At the peak of inhalation, lungs are maximally filled with both air and blood. When we exhale, this same volume of blood is ejected from the lungs into the pulmonary veins where it flows to and through the left heart into the arterial tree. At the peak of exhalation, lungs are maximally empty of both air and blood. This leads to a wave action in the circulation, blood volume rising during exhalation and falling during inhalation, blood pressure rising and falling by as much as 30mmHg with exhalation and inhalation, respectively. The autonomic nervous system desires this wave action and coordinates both heart and vascular activities to facilitate the wave. As such, when we inhale, the heart speeds up to facilitate venous blood flow into the low pressure zone of the lungs. When we exhale, the heart slows down, facilitating blood flow from the lungs into the high pressure zone of the arterial tree. When we inhale and exhale "coherently" we see this phenomenon occur with each cycle of respiration. If in the figure above, we measure and plot blood volume in between heart beats, i.e. at each cardiac diastole, we derive the Valsalva Wave in the absence of the pulse. Averaging this yields the "Smooth" Valsalva Wave depicted below.
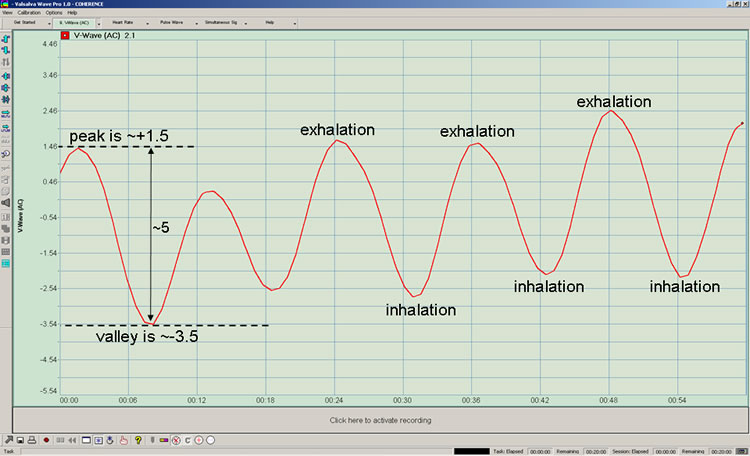
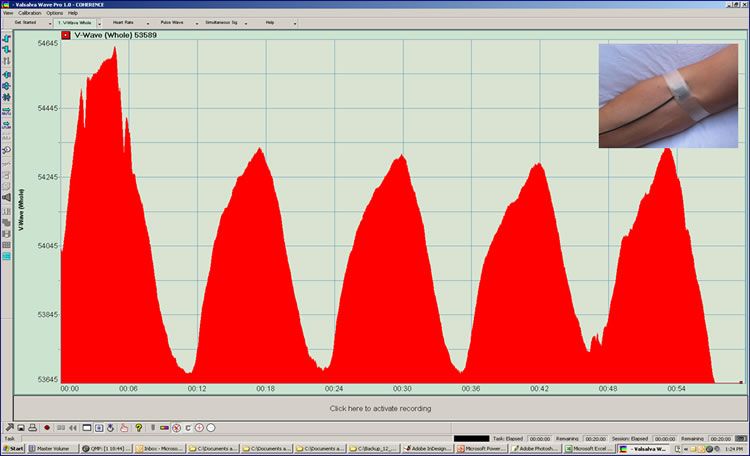
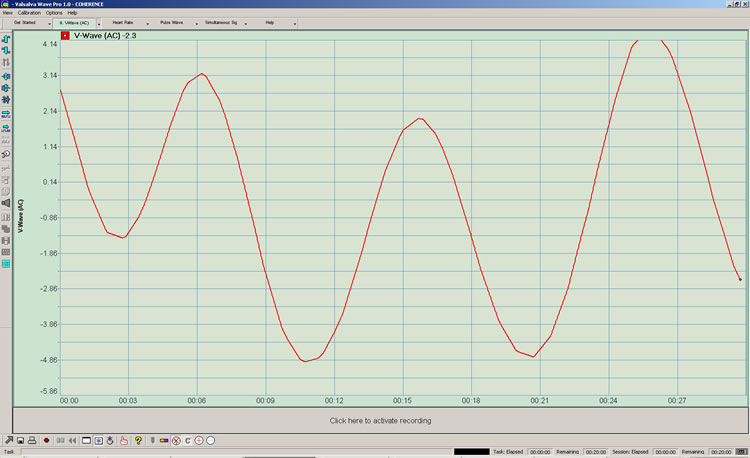
The (AC) Valsalva Wave While Breathing "Coherently" Our primary training objective is to breathe in such a way that the Valsalva Wave rises and falls with respiration. We can think of this as "variability" of blood volume as a function of respiration. The extent to which it rises and falls is referred to as its "variability". In the figure above, we see the peak of the wave measures +1.5 and the valley measures -3.5. Subtracting the valley from the peak, the "variability" of the wave is ~5. The instrument measures this variability for us, both short and long term. You can find these measurement functions, "V-Wave Variability" and "V-Wave Variability Average", as well as "V-Wave Variability %" and "V-Wave Variability Average %", under this tab. The "%" measurements divide the "AC" component by the average or "DC" component. This "% variability" method allows us to accurately determine the "variability" of blood volume regardless of where it is measured, e.g. ear lobe, finger, toe, etc., and regardless of the pressure being applied by the sensor. The Valsalva Wave can be observed at: Termini: ear lobes, finger tips, toe tips, etc.,
Arteries that we can access: radial artery, temporal artery, etc.,
Veins that we can access: medial cubital vein, radial vein, jugular vein, etc.
1.
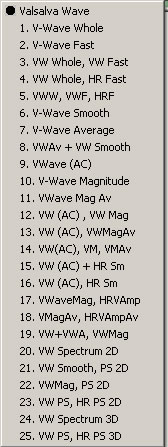
About the name "Valsalva Wave"... In medical literature there is a term given to the understood but little recognized wave action as observed in the arterial system as a function of breathing. It is called the "respiratory arterial pressure wave". There is also a relatively obscure term for a wave phenomenon in the venous system - the "venous wave". However, there is no term for the wholistic "circulatory" phenomenon, arterial and venous emphasis alternating with exhalation and inhalation, respectively. Antonio Valsalva (circa 1600), an early physiologist, is said to have observed changes in the jugular vein as a function of respiration, making him one of the earliest recorded observers of the interaction between breathing and blood flow. Bob Grove (J & J Engineering) and I coined the name "Valsalva Wave" to describe the wholistic circulatory phenomenon, "A" for arterial and "V" for venous. Valsalva Wave Series Please note that these particular views are representative of what you will see on each of the screens and do not represent a specific training recommendation. Independently numbered graphs do not relate to each other in time or amplitude. Valsalva Wave metrics are "red" (connoting blood) and heart rate metrics are "blue" throughout. The Valsalva Wave menu:
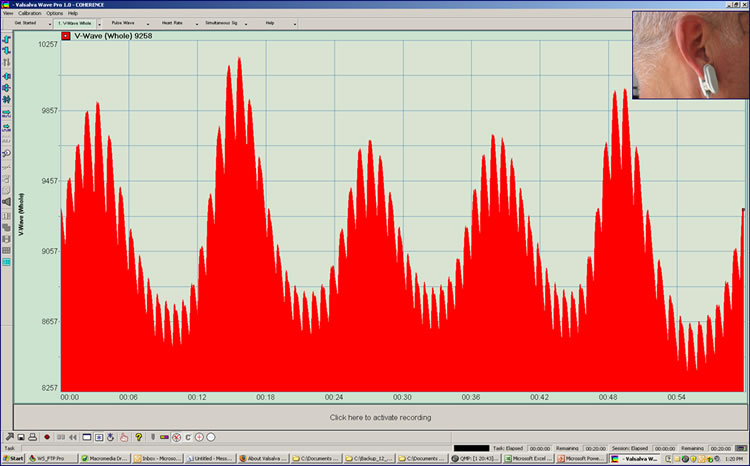
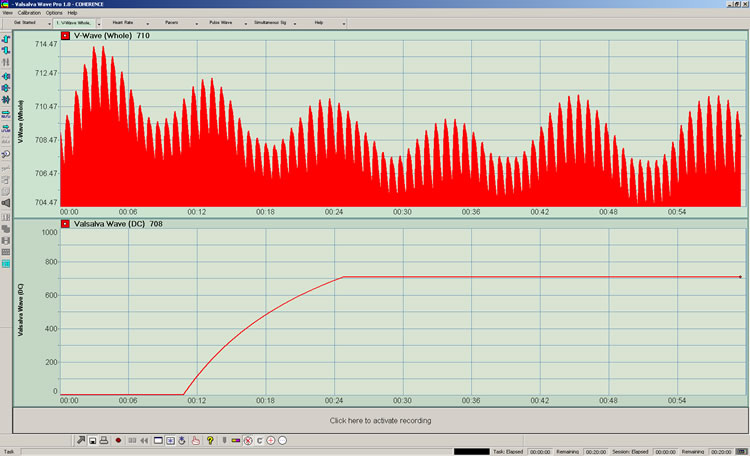
1. Valsalva Wave (Whole): The top panel is the most fundamental view of the blood in the body part being monitored. It is representative of what the DC plethysmograph sees. Red=blood. Heart Rate Fast is also indicated. The bottom panel is the longer term view of "DC" blood volume.
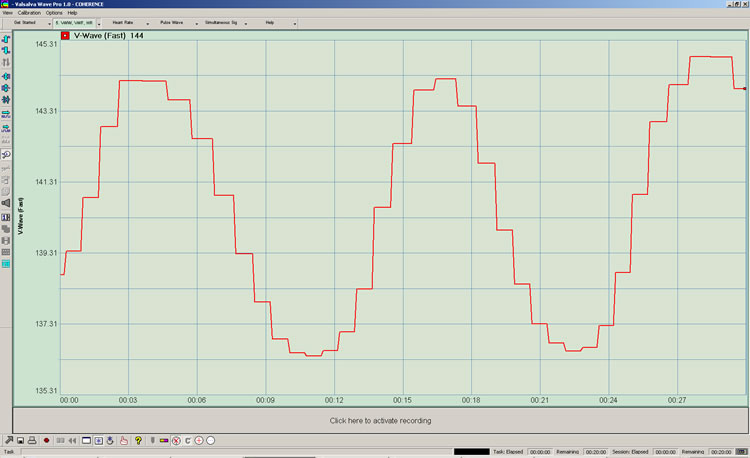
2. Valsalva Wave (Fast): The Fast V-Wave is derived by measuring the blood volume value during each cardiac diastole. This yields a signal that is representative of the slow respiratory component of the Whole Valsalva Wave depicted above. It is called "fast" because there is minimal averaging/smoothing delay.
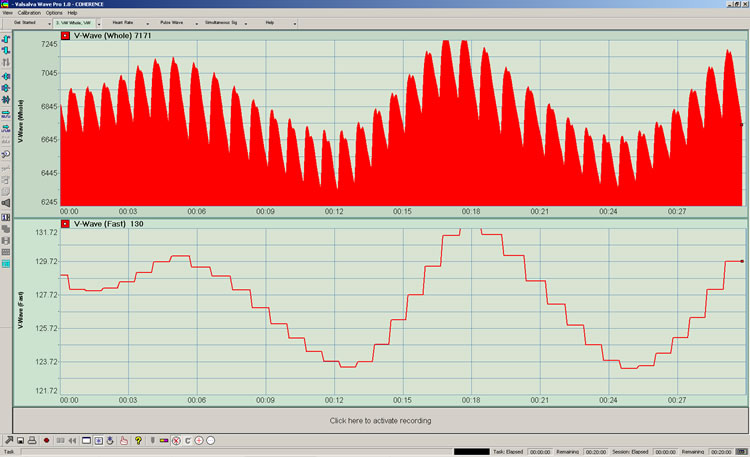
3. Valsalva Wave (Whole), Valsalva Wave (Fast): This depicts simultaneous views of the Whole V-Wave and the Fast Valsalva Wave.
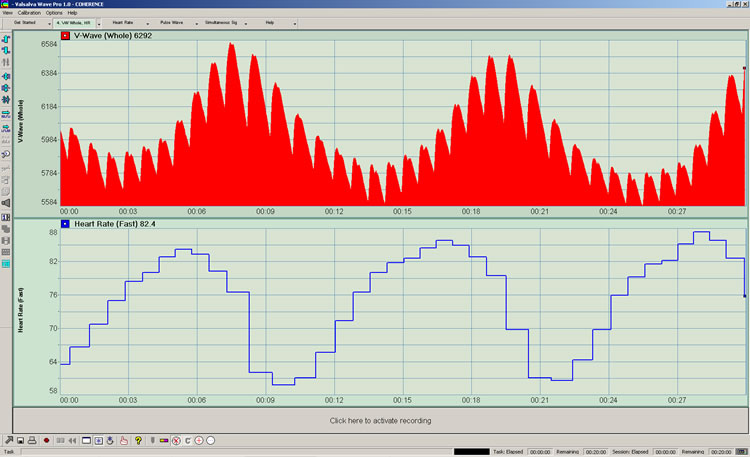
4. Valsalva Wave (Whole), Heart Rate (Fast): This depicts simultaneous views of the Whole Valsalva Wave and the Fast Heart Rate.
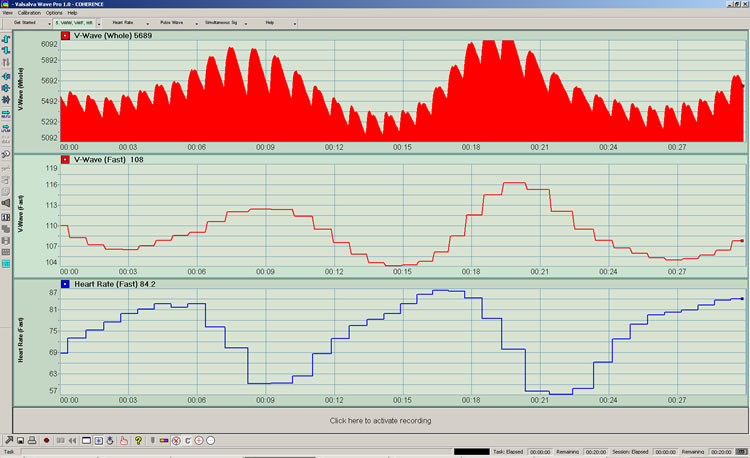
5. Valsalva Wave (Whole), Valsalva Wave (Fast), Heart Rate (Fast): Here all three are depicted simultaneously.
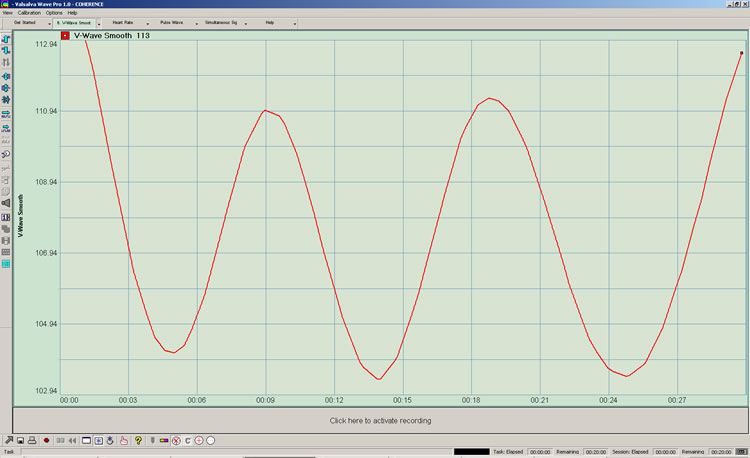
6. Valsalva Wave (Smooth): The Smooth Valsalva Wave is derived by averaging the Fast V-Wave signal. It is more pleasing but still real time responsive, depending on where measured. (Where the action of the blood in the ear is near "real time" with respiration, the action of the blood in a digit can be delayed by several seconds.)
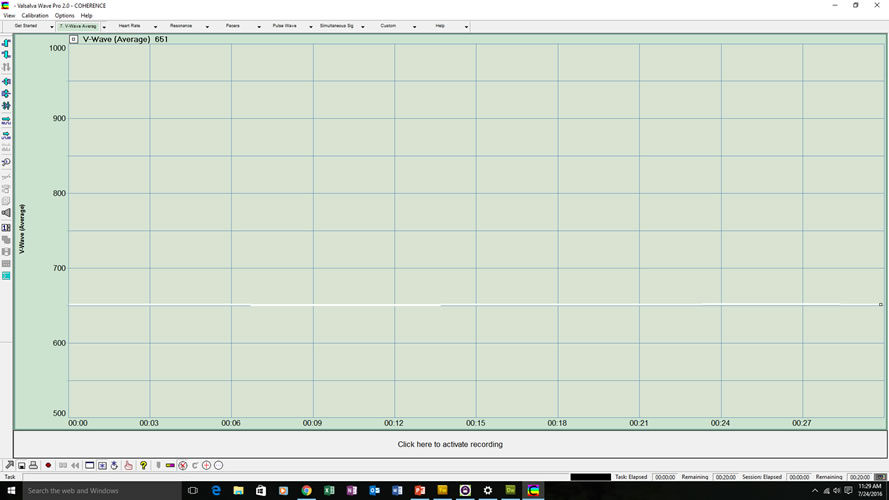
7. Valsalva Wave Average: The average or "DC" blood level. This signal is created by averaging the Fast V-Wave over a long period of time. For this reason, it takes about 60 seconds for it to begin to rise above a value of zero.
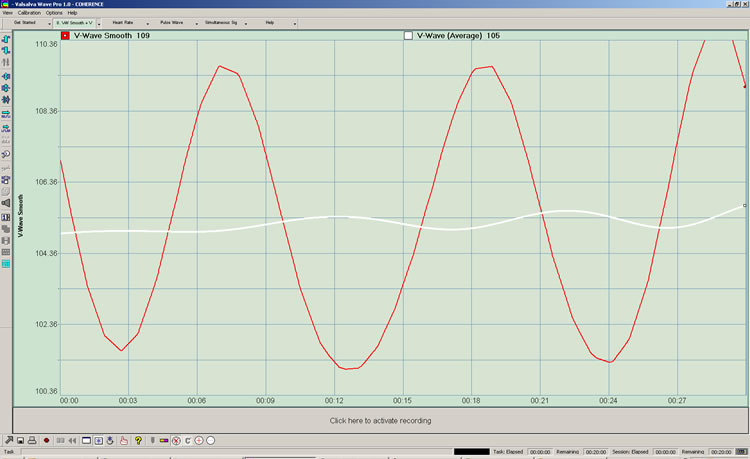
8. Valsalva Wave Smooth + Valsalva Wave Average: The smooth Valslava Wave winds around the average or "DC" blood level. This display yields a particulary stable view of the Valsalva Wave.
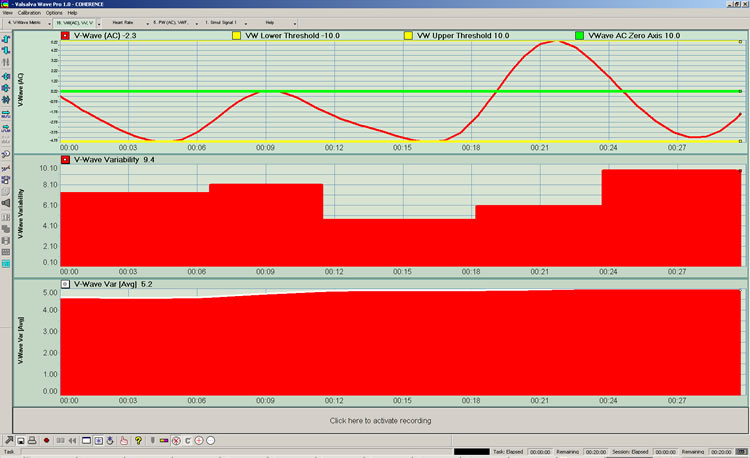
9. Valsalva Wave (AC): The AC V-Wave generally varies around an X axis of zero. In other words the DC component of the Valslava Wave Wave has been removed and all we see is the AC variation. It is useful when we are interested in observing variability. As of Release 09_01_10 upper and lower visual thresholds are provided. The green line is the X axis around which the AC wave is centered.
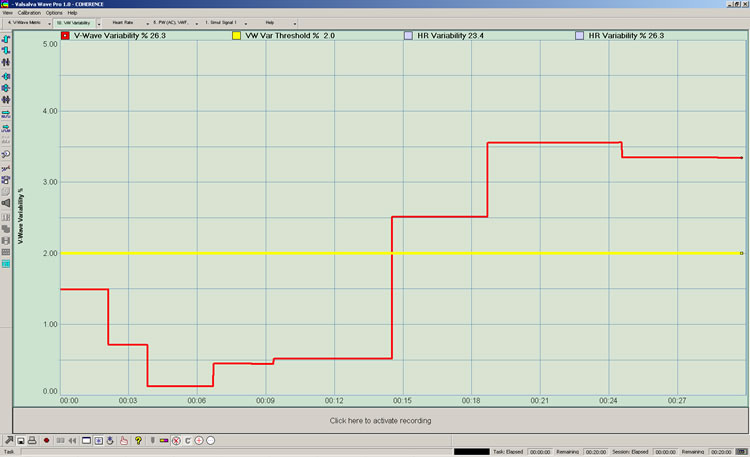
10. Valsalva Wave Variability %: This function measures Valslava Wave variability or peak-minus valley in %. It is derived by dividing the variable aspect of the wave by the wave's average and multiplying by 100. It is reponsive to breath-to-breath changes. Valsalva Wave "variability" is not unlike heart rate variability, however here we are measuring the peak-peak value of an actual physical wave. (Note that the heart rate variability cycle is not an actual physical wave; it is a plot of the interbeat interval divided into 60 seconds.) With Release 09_01_10, thresholding is provided. In the figure below the threshold is set to the default value of 2%. HR Variability and HR Variability% values are also presented.
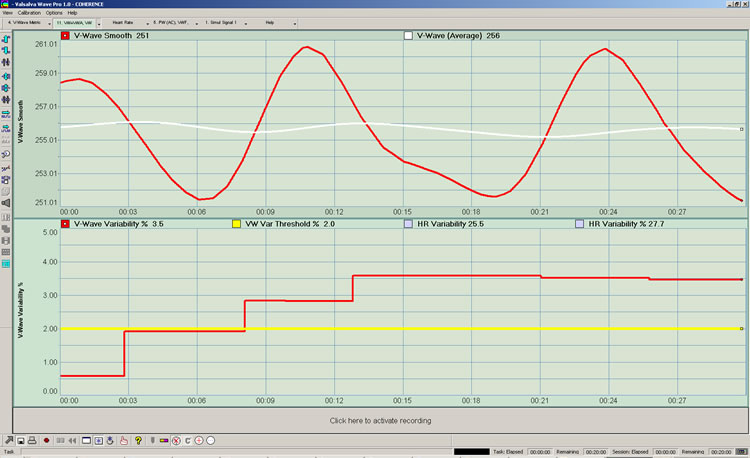
11. Valsalva Wave Smooth AND Valsalva Wave Average, Valsalva Wave Variability %: This screen provides a very stable view of the Smooth Valsalva Wave winding around the average or "DC" value. Dividing the Smooth wave by the average and multiplying times 100 yields Valslava Wave variability as a percentage of total blood volume. Given the technical challenges of assessing blood volume without modifying it, we have choosen "% variability" as a "standard" measure.
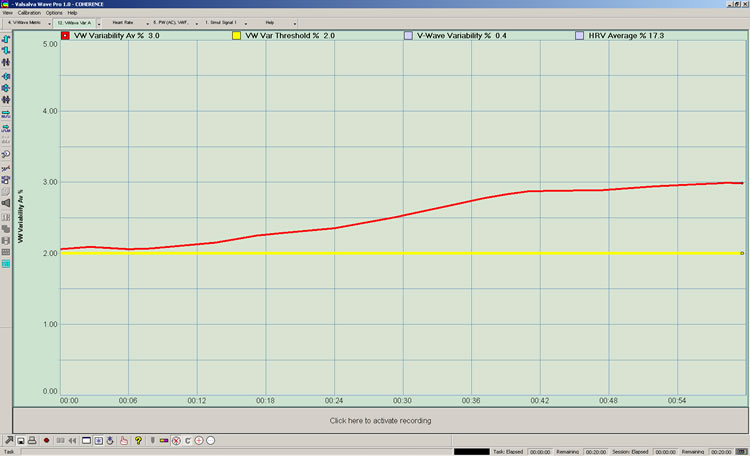
12. Valsalva Wave Variability Average %: This is a longer term average of Valsalva Wave Variability %. It is not responsive to breath-to-breath changes in the height of the wave. However, it is useful for working with variability over a period of 10s of seconds or longer. Thresholding is active on this screen.
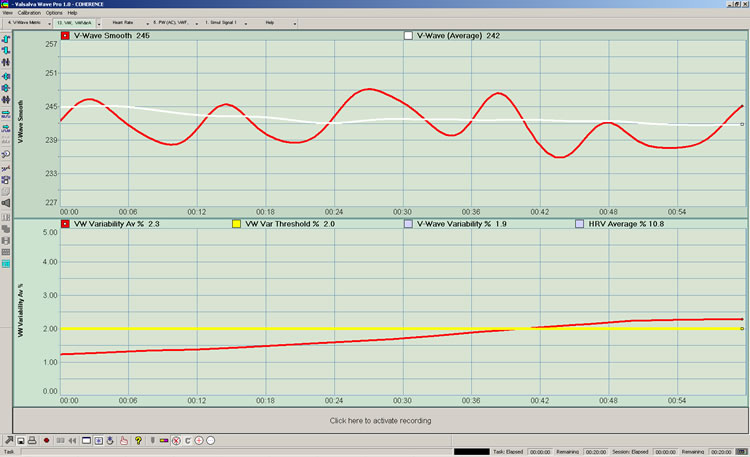
13. Valsalva Wave Smooth AND Valslava Wave Average, Valsalva Wave Variability Average %: The top panel presents Valsalva Wave Smooth and Average, the bottom panel the longer term average as a percentage.
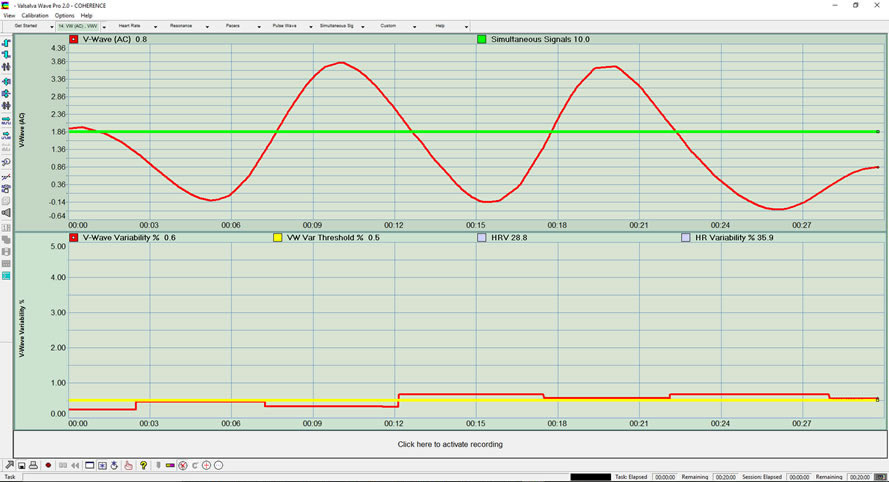
14. Valsalva Wave (AC), Valsalva Wave Variability %: This screen simply shows simultaneous views of the Smooth "AC" Valsalva Wave and Valsalva Wave variability as a percentage. It is useful for understanding the relationship between the "wave" and the variability measurement.
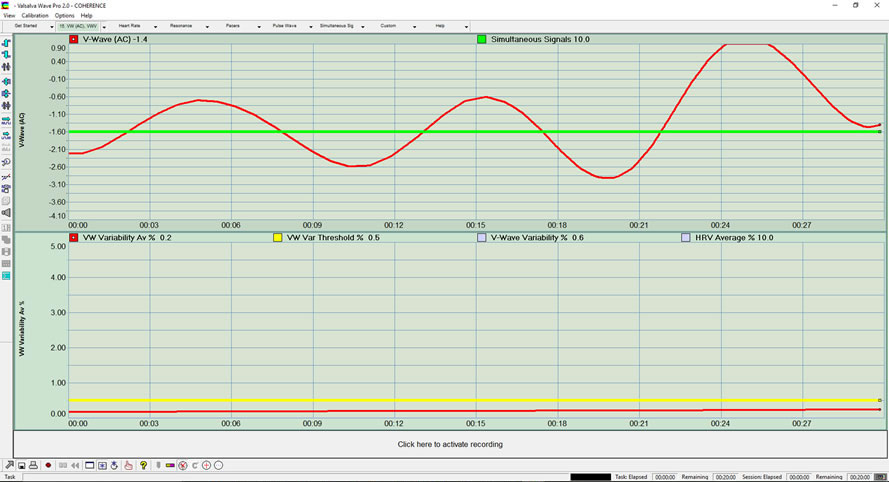
15. Valsalva Wave (AC), Valsalva Wave Variability Average %: This screen is the same as #14 but employs the longer term variability average.
16. Valsalva Wave (AC), Valsalva Wave Variability, Valsalva Wave Variability Average: This screen allows us to see the AC wave, the "uncalibrated" short term variability measure, and the "uncalibrated" longer term average.
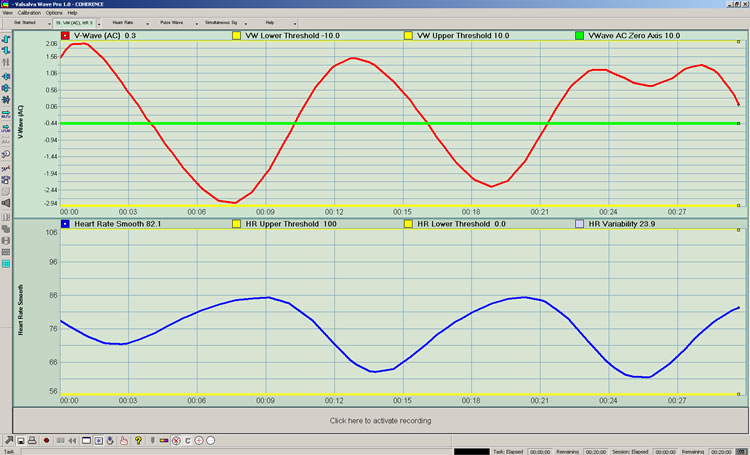
17. Valsalva Wave (AC) AND Heart Rate (Smooth): This screen presents simultaneous views of the "AC" Valsalva Wave and the Smooth Heart Rate. The Y-axis is that of the V-Wave, centered around zero. The Heart Rate is simply centered on the screen. Heart rate timing is relvant; Heart Rate amplitude is not.
18. Valsalva Wave (AC), Heart Rate Variability (Smooth): This sceen presents both Valsalva Wave and Heart Rate simultaneously on different graphs. Here they each have their own Y axis and are accurate in terms of both time and amplitude.
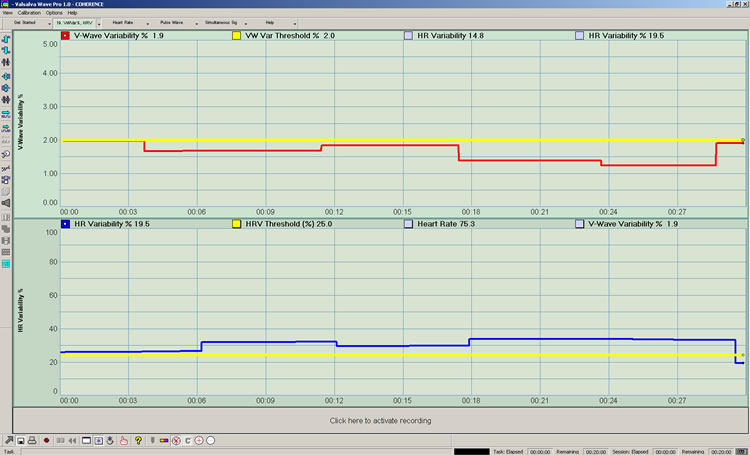
19. Valsalva Wave Variability %, Heart Rate Variability %: Simultaneous views of Valsalva Wave variability as a percentage of average blood volume and and Heart Rate variability as a percentage of average heart rate.
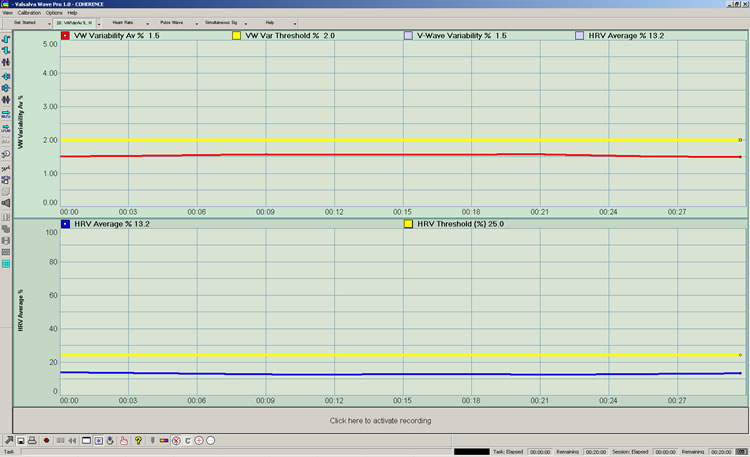
20. Valsalva Wave Variability Average %, Heart Rate Variability Average %: Simultaneous views of the Valsalva Wave Variability longer term average and the Heart Rate Variability longer term average as percentages.
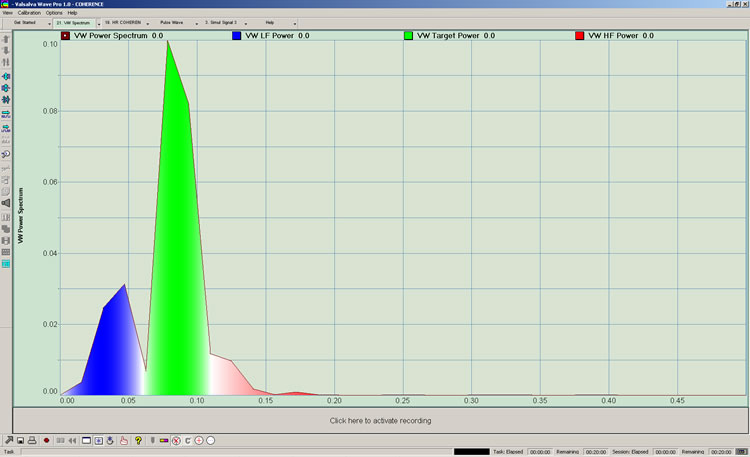
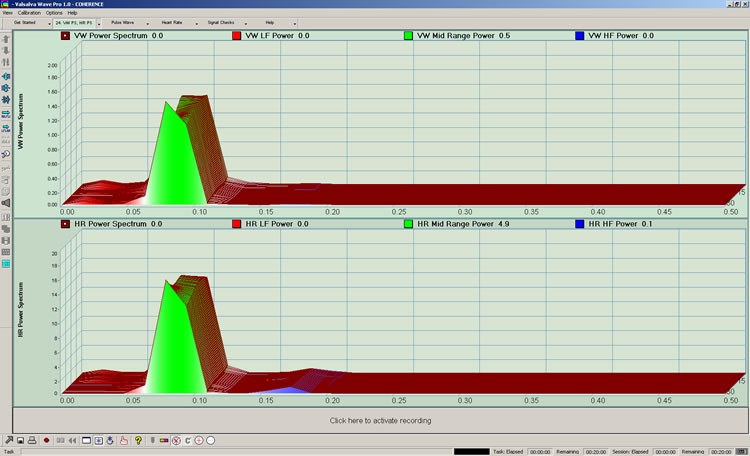
21. Valsalva Wave Power Spectrum (2D): This screen depicts the two dimensional "power spectrum" of the Valsalva Wave. The power spectrum tells us the "frequency makeup" of the signal. The view is divided into 3 "bands". See Get Started Valsalva Wave metrics for details of the bands. It is generally understood that spectrum to the left of the green band (blue) is associated with slower sympathetic function. Spectrum to the right of the green band (red) is associated with relatively more rapid parasympathetic function. The green band is generally understood to represent equal sympathetic and parasympathetic emphasis, where spectral contribution of sympathetic and parasympathetic systems is similar in both frequency and power.
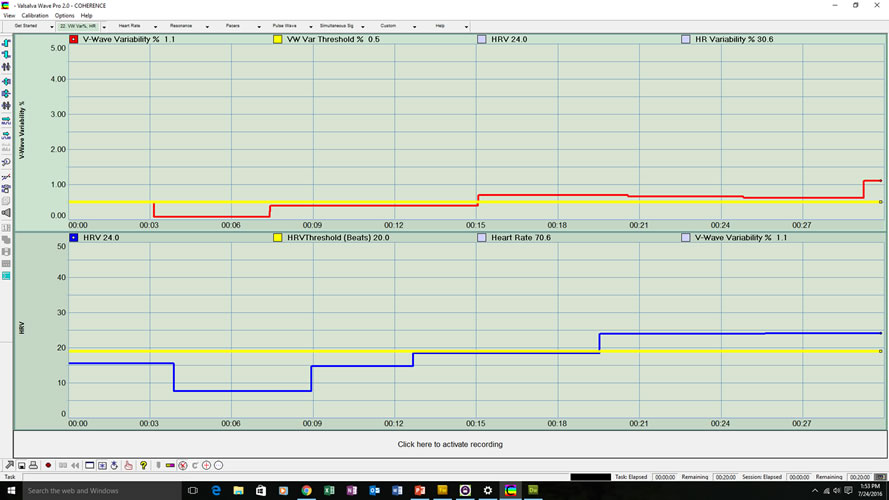
22. Valsalva Wave Variability %, HRV: This screen allows us to view V-Wave Variability in combination with Heart Rate Variability (HRV).
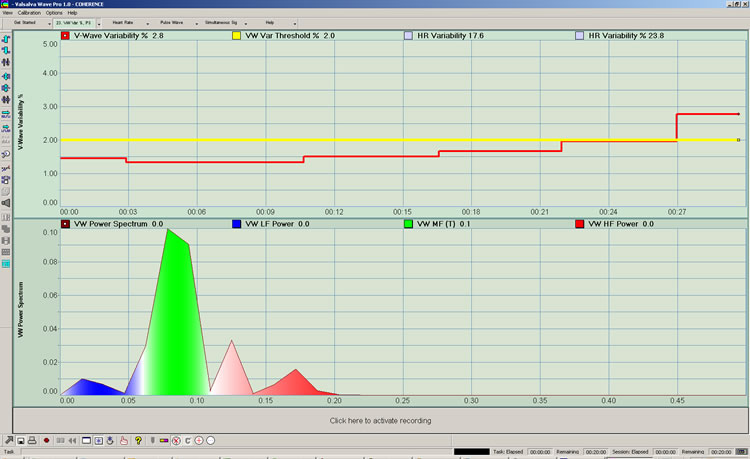
23. Valsalva Wave Variability %, Valsalva Wave Power Spectrum (2D): This screen allows us to view V-Wave Variability as a percentage in combination with the 2D power spectrum.
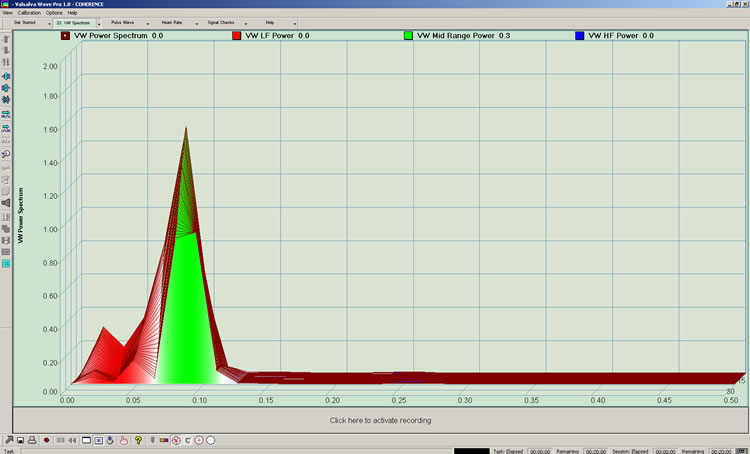
24. Valsalva Wave Power Spectrum (3D): This is a three dimensional view of the power spectrum, allowing us to see more clearly how frequency changes with time.
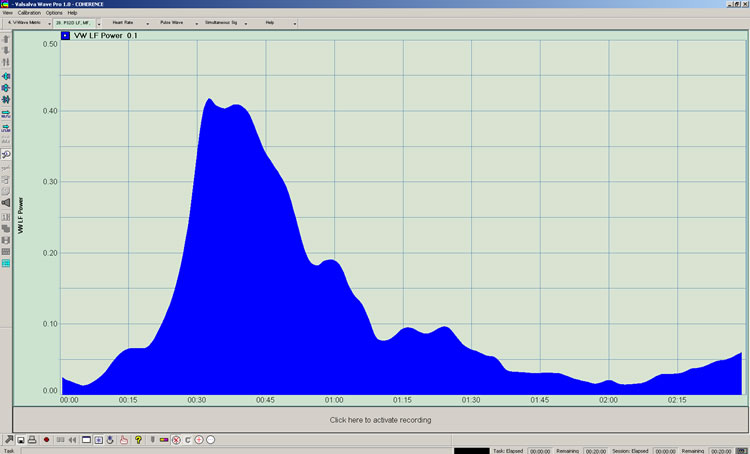
25. Valslava Wave Low Frequency Power (0-.06Hz): Power of the low frequency component only as it varies in time. The low frequency component correlates highly with sympathetic activity. This screen presents a "real time" view of low frequency power level and is not cumulative. There is correlation in time between views 25, 26, and 27.
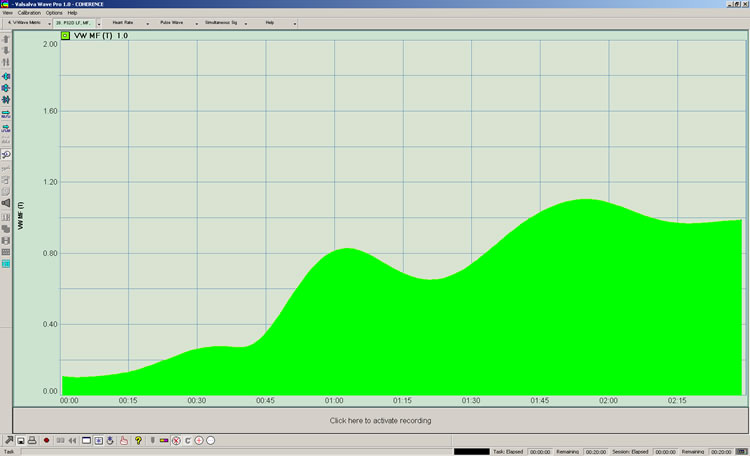
26. Valsalva Wave Mid-Frequency (.06-.11Hz): Power of the mid frequency component only as it varies in time. The mid-frequency component correlates highly with sympathetic/parasympathetic balance. This screen presents a "real time" view of mid-frequency power level and is not cumulative. There is correlation in time between views 25, 26, and 27. The name "VW MF (T)" stands for Valsalva Wave Mid- Frequency (Target) as this band is the "target band".
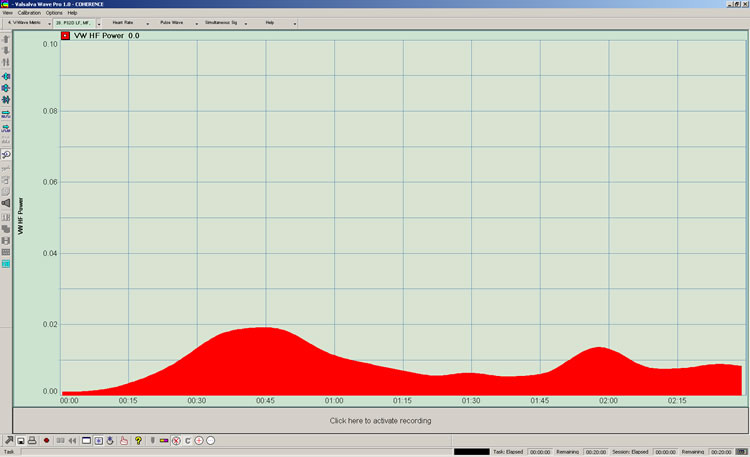
27. Valsalva Wave High Frequency (.11-.4Hz): Power of the high frequency component only as it varies in time. The high-frequency component correlates highly with parasympathetic activity. This screen presents a "real time" view of high frequency power level and is not cumulative. There is correlation in time between views 25, 26, and 27.
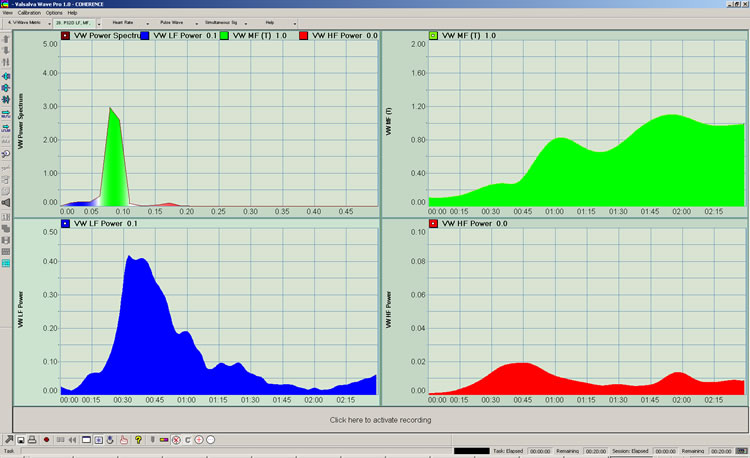
28. Valsalva Wave Power Spectrum (2D), Lo-Frequency, Mid-Frequency, and High Frequency Power: This presents a combined view. There is correlation in time between Low Frequency, Mid-Frequency, and High Frequency views. The 2-D Power Spectrum (upper left quadrant) is cumulative.
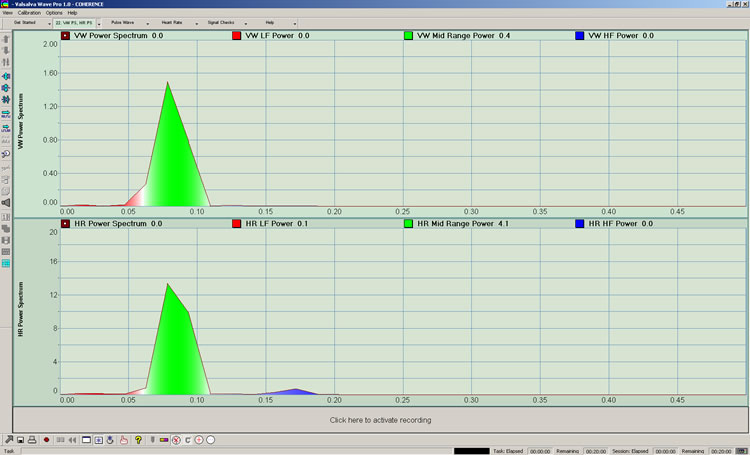
29. Valsalva Wave Power Spectrum (2D), Heart Rate Power Spectrum (2D): This screen allows us to see and compare 2 dimensional power spectra of the Valsalva Wave and the Heart Rate. Valsalva Wave and Heart Rate frequency band definitions are the same. See Get Started.
30. Valsalva Wave Power Spectrum (3D), Heart Rate Power Spectrum (3D): This screen allows us to see and compare 3 dimensional power spectra of the V-Wave and the Heart Rate. Valsalva Wave and Heart Rate frequency band definitions are the same. See Get Started.
Copyright 2016 COHERENCE LLC (V2.0, July 2016) |

+HR_smooth.jpg)