|
Home Get Started (Internet) |
||||||||||||||||
|
|||||||||||||||||
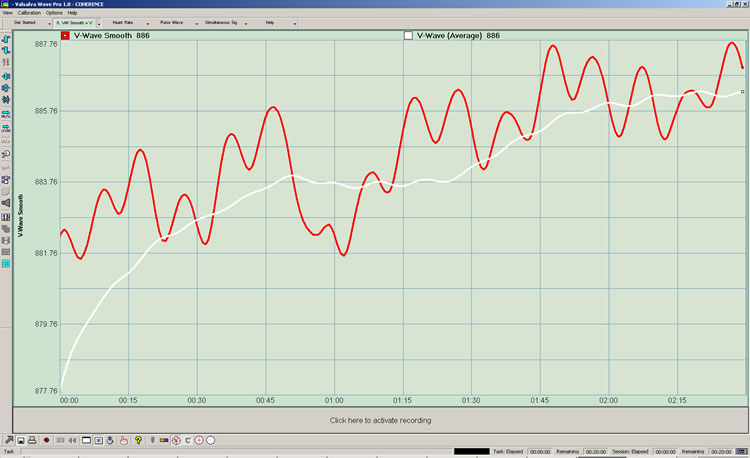
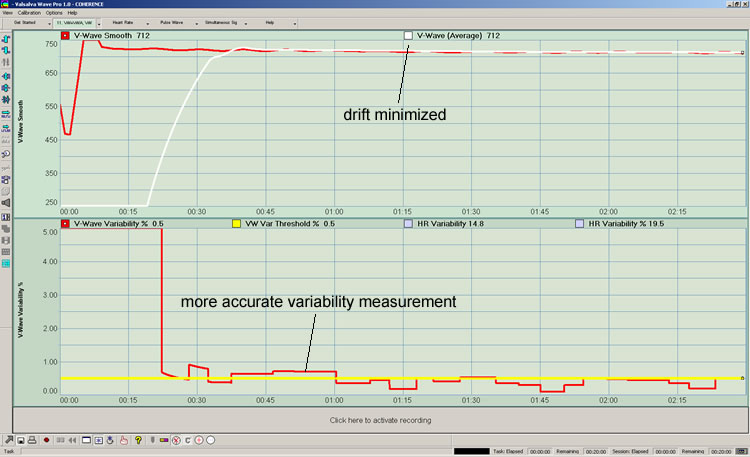
October 24th, 2010 Purchase Subscribe to Valsalva Wave News - Its Free! Valsalva Wave News - Issue #1: Calibration Hello everyone, Welcome to V-Wave News Issue #1. V-Wave News is a new publication that aims to provide the growing Valsalva Wave Pro user community with information about the Valsalva Wave phenomenon, the instrument, and its application. In this first issue, we address the matter of "standard" Valsalva Wave measurement and the long outstanding issue of "calibration". We'll also discuss ear and finger sensors and their respective challenges. Regarding accuracy of Valsalva Wave measurements, these are the measures of concern: 1) Valsalva Wave Variability: the degree to which blood volume varies - principally with respiration, and 2) Valsalva Wave Average (average blood volume): the blood volume longer term average, which may also vary during resonant respiration vs. before or after. Standards set forth: - The standard set forth for "Valsalva Wave Variability" is as a percentage of average blood volume. Valsalva Wave Variability (%) = (Valsalva Wave Smooth/Valsalva Wave Average) X 100. These metrics relate to Valsalva Wave menu options #10, #6, and #7 respectively. The standard for "average blood volume" or "Valsalva Wave Average" differs with finger and ear sensors. This is due to mechanical differences between finger and ear sensors and differences in the behavior of blood volume at the finger vs. ear, which we believe has something to do with being below vs. above chest level. When we attach the sensor to the finger, the elastic band exerts a certain amount of pressure on the finger, squeezing blood out of it. This results in a decrease in average blood volume at the finger tip relative to what it was before applying the band. This causes a temporary decline in Valsalva Wave Average (the white line of Figure 1). However, the body seems to respond to this external pressure by increasing internal pressure, causing average blood volume to once again increase. (Please note that these curious physiological responses are still being investigated.) At present, it appears that Valsalva Wave Average, as measured at the digits with the elastic sleeve applied, is relatively self-correcting, i.e. the body adjusts to the pressure applied with the apparent objective of maintaining normal blood flow. See Figure 1.
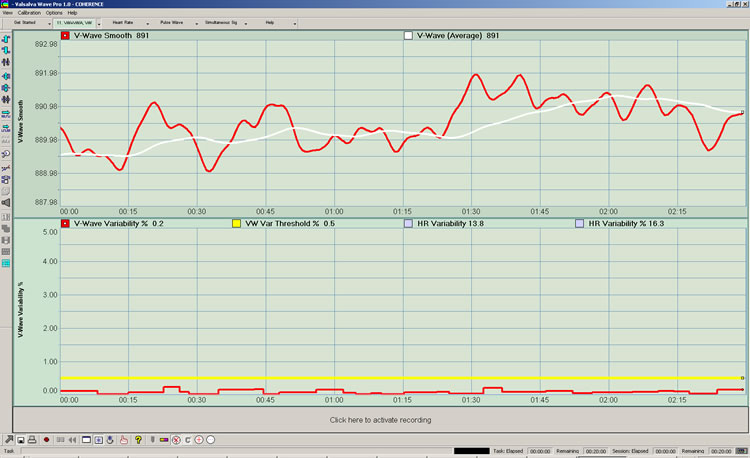
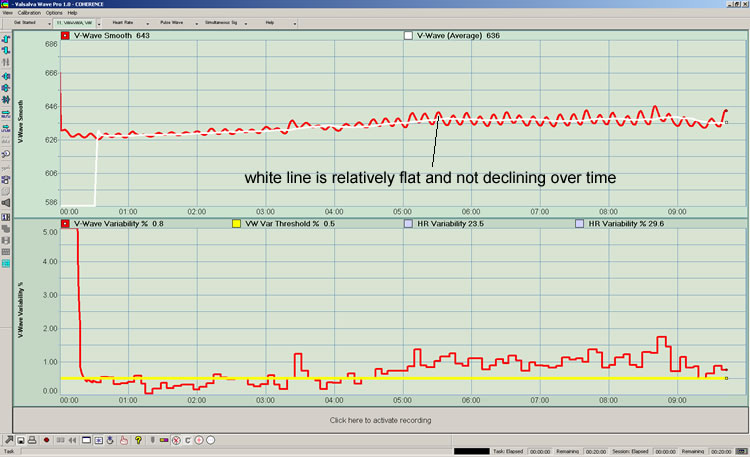
FIGURE 1: Valsalva Wave Smooth and Valsalva Wave Average assessed at the thumb demonstrating characteristic gradual increase over time. In Figure 1, we see average blood volume (the white graph) gradually increasing in value, its general relationship to the Valsalva Wave Smooth (the red graph) being preserved. Some portion of this gradual increase may also be due to the circulatory effects of deep rhythmic respiration. This represents work in progress. Regarding accuracy of the Valsalva Wave Variability measurement at the fingers, because the averaging algorithm is relatively fast, as average blood volume gradually varies due to pressure and physiologic response, the relationship between variable and "DC" components is preserved, hence, accuracy of the Valsalva Wave Variability measurement is maintained. See Figure 2.
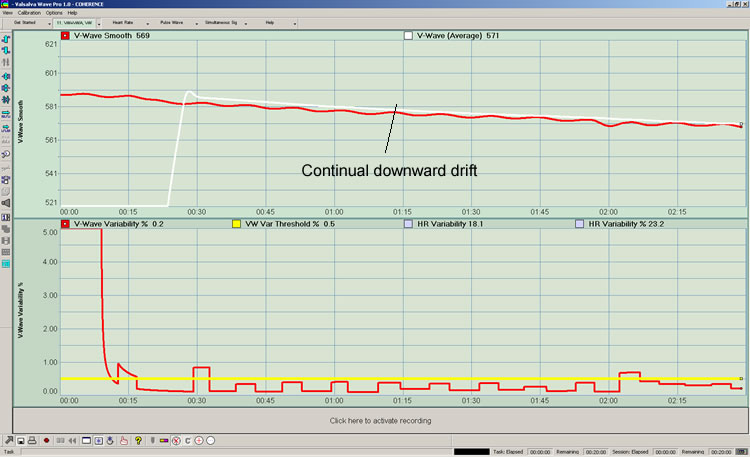
FIGURE 2: Another view of Valsalva Wave Smooth and Valsalva Wave Average along with Valsalva Wave Variability (Valsalva Wave menu #11), assessed at the thumb Hence for now, the finger sensor standard set forth for Valsalva Wave Average (the white line) is a line that is somewhat variable, around which is centered Valsalva Wave Smooth (the red line). Note that if one does not need to measure simultaneous heart rate, the elastic sleeve can be avoided all together and the sensor can be taped longitudinally to the thumb or finger. This makes it possible to study the physiology of blood volume in the digits without pressure related complications. ~ The ear sensor presents a different challenge. Like the finger, when the ear sensor is applied to the earlobe, it squeezes blood out of the sensed area, resulting in an immediate decrease in average blood volume. But unlike the hands, application of the clip results in continuously decreasing volume over many minutes, confounding Valsalva Wave Average as well as Valsalva Wave Variability measurements. See Figure 3.
FIGURE 3: Valsalva Wave option #11 with ear clip (without drift kit installed)
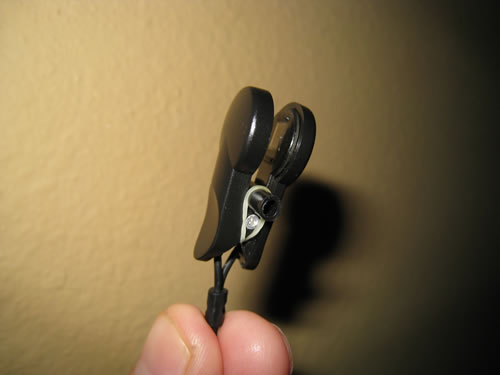
This drift tendency has been mitigated by placing a small block in the clip, otherwise known as a "drift kit", keeping the clip from squeezing down more than "vertical". However, as you continue to work with the sensor, the single block is warn down slightly so as to allow it to close too much. For this reason, two blocks are presently being installed before shipment.
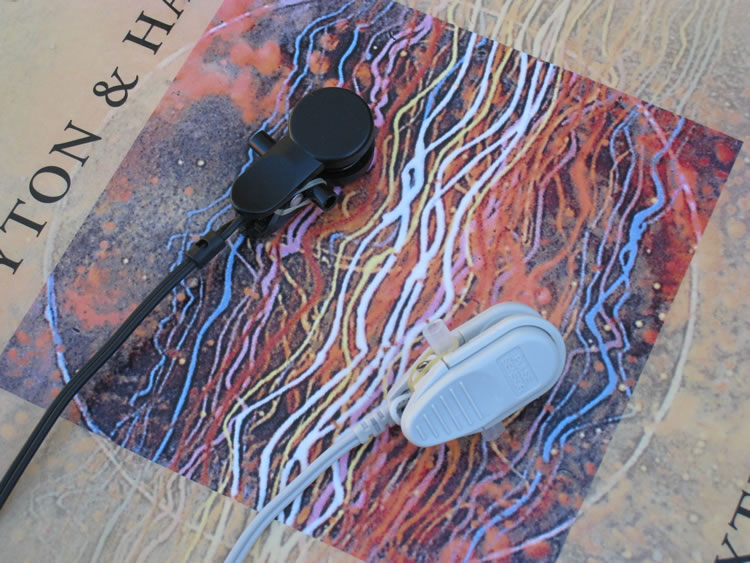
FIGURE 4: Ear clip with installation of improved "drift kit" (View Close Up)
2 blocks yield a relatively flat average blood volume but a very loose fit. For this reason it is recommended that the strain relief be attached to the shirt collar and if need be, the use of body tape to secure the clip to the ear. The tape should simply keep the sensor from falling off. Note that if one is working with both Valsalva Wave and heart rate, the clip must be tight enough to pick up both signals. The heart beat is more difficult to detect than blood volume. For this reason, it is possible to detect the latter without the former. To confirm that both signals are being detected adequately, go to "Get Started" then "Basic Signals". All four graphs should demonstrate viable data. Figures 5 & 6 demonstrate the ear clip with proper control of "drift" via installation of the "drift kit".
FIGURE 5: Valsalva Wave option #11 with ear clip (drift kit installed)
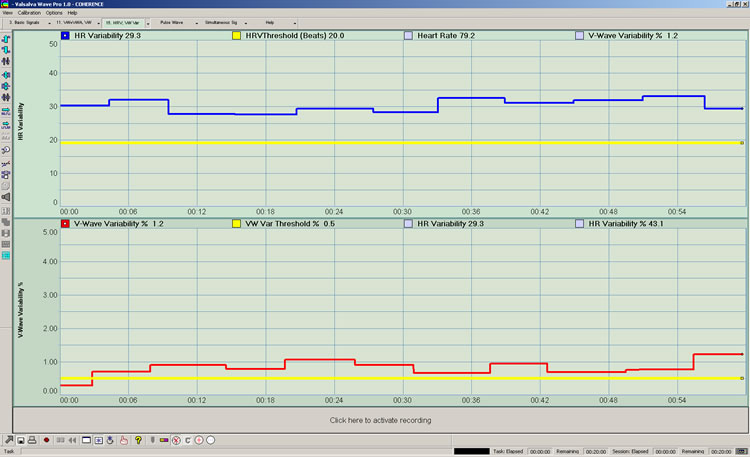
FIGURE 6: Longer term view of Valsalva Wave option #11 with ear clip (with drift kit) ~ One of the key interests in the Valsalva Wave phenomenon is the relationship of both average blood volume and Valsalva Wave variability to heart rate variability, e.g. Figure 7.
FIGURE 7 - Heart rate #15 (HR, VWVar%): Heart rate variability on the top panel and Valsalva Wave variability on the bottom panel. The yellow lines are respective default thresholds.
This is the topic of Issue #2 of V-Wave News. See you then, Stephen Elliott Patent Pending Copyright 2010, COHERENCE LLC
|