RESONANCE
The Menu
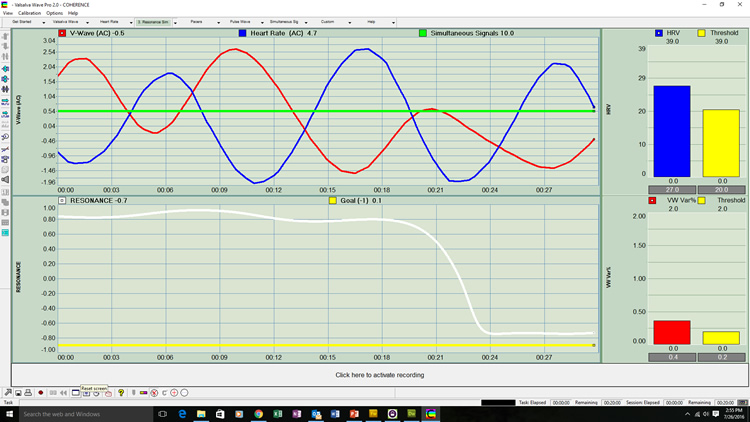
Figure 1: The Resonance Simultaneous Screen With Valsalva Wave & Heart Rate
With Valsalva Wave Pro 2.0 the "Coherence Curve" is replaced by the "Resonance Curve". The measure remains the same, the correlation coefficient between the Valsalva Wave induced by diaphragm movement and the heart rate variability (HRV) cycle that it produces via generation of the respiratory arterial pressure wave that rises with exhalation and falls with inhalation in the arterial tree.
Resonance is the indication that the circulatory system (inclusive of the lungs) is oscillating at its natural frequency, what is referred to in The New Science Of Breath as the "natural quiescent rhythm", which is slightly unique for everyone. The advantage of finding one's unique rhythm is analogous to finding the natural pitch of a string, the frequency at which our circulatory system naturally vibrates. It defines the frequency and state at which our circulatory system naturally operates with balance and efficiency. Once we know that frequency, we can consciously "tune" our bodies to work at that rhythm.
When the circulatory system is operating at resonance, arterial and venous flows are equal, and the diaphragm and thoracic pump are performing their natural roles of returning blood to the lungs during inhalation and sending blood to the arterial tree via the left heart during exhalation. Blood is drawn from the feet (below the chest) during inhalation and sent to the brain (above the chest) with exhalation, assuming an upright body position. Evidence is emerging that resonant circulation reaches deeper into the parenchyma, functional tissues throughout the body, hydrating, nourishing, cleaning...
Resonance is a measure of the phase relationship between the breathing induced Valsalva Wave and the heart rate variability cycle it induces. It is indicated by the "Resonance Curve" which approaches -1 as the phase alignment nears 180 degrees. The Resonance Curve is the correlation coefficient of the two phenomena. In theory the Resonance Curve can never be -1 because the heart rate variability cycle (blue) is an autonomic outcome of the Valsalva Wave (red), and must therefore lag slightly behind the Valsalva Wave. However, as described in Personal Resonance Protocol, it is possible to sustain -.98 for 5 minutes or longer.
The yellow threshold in the lower panel is a threshold that is settable in .05 increments so one is able to set it at their personal best. To discover one's personal resonant frequency, it is recommended that one realize and sustain a Resonance Curve below -.8, record it for 5 minutes, and then post process the record to find the frequency that produced the best effort resonance. This is explained in detail in Personal Resonance Protocol, including performing Fourier analysis using Excel to discover one's personal resonant frequency.
1. Resonance - Valsalva Wave: The top left panel is Valsalva Wave (AC); the top right is Valsalva Wave Variability (%); the bottom left is Resonance, the correlation coefficient between the Valsalva Wave and the Heart Rate Variability Cycle it produces; on the bottom right is Valsalva Wave mid-range power.
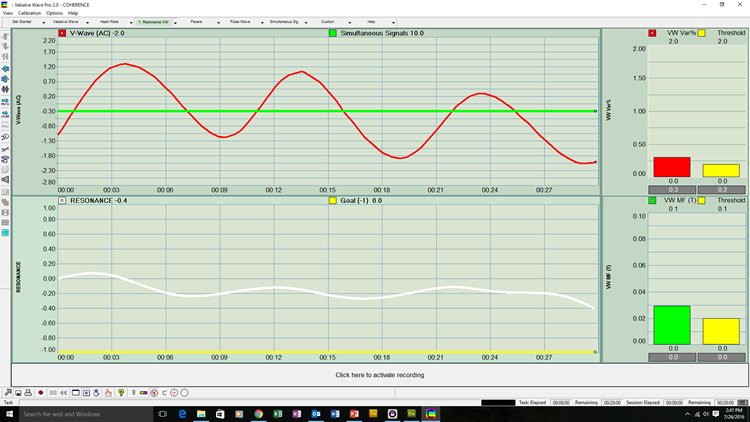
Resonance can be realized by breathing in synchrony with the first order biometric, the Valsalva Wave inhaling at peaks and exhaling at valleys.
2. Resonance - Heart Rate:
Or, resonance can be realized by breathing in synchrony with the heart rate variability (HRV) cycle, the 2nd order biometric, exhaling at peaks and inhaling at valleys, the opposite method relative to Valsalva Wave biofeedback. Notice the "Set Threshold" dialog in the upper left corner of the screen. It is setting the "Resonance" threshold. Anywhere a yellow graph exists, one can click on that panel, then on the "set threshold" on the left vertical settings bar, then set the threshold. In all three Resonance screens, there are three settable thresholds, 1 for the Resonance curve, and one for each of the bar graphs.
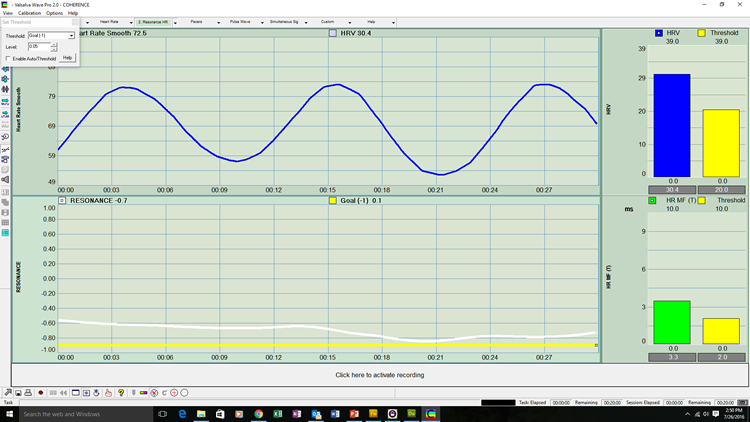
Resonance can be realized by breathing in synchrony with the 2nd order biometric, the Heart Rate, exhaling at peaks and inhaling at valleys.
3. Resonance - Simultaneous (Simultaneous Valsalva Wave & HRV)
The simultaneous screen presents the complete picture, demonstrating the real time phase relationship between the Valsalva Wave and the Heart Rate Variability Cycle it produces. Resonance approaches -1 as their phase relationship approaches 180 degrees.
Copyright 2016 COHERENCE LLC
(V2.0 July 2016) |

