Under Revision
The Get Started menu:
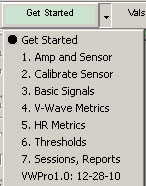
1. Basic Signals: See description of each graph below.
The Basic Signals |
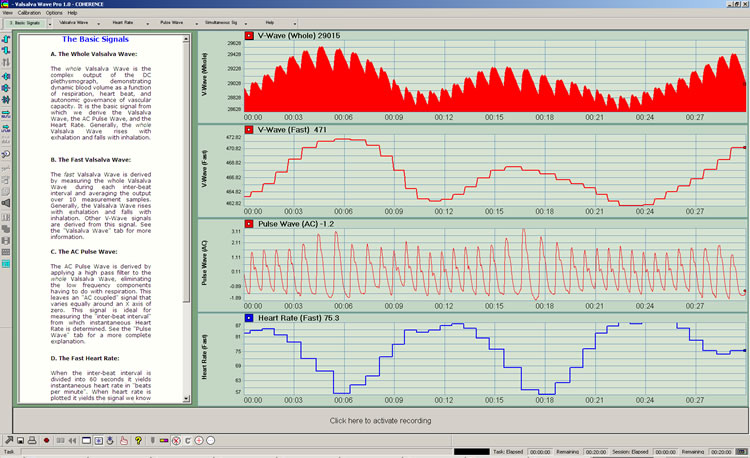
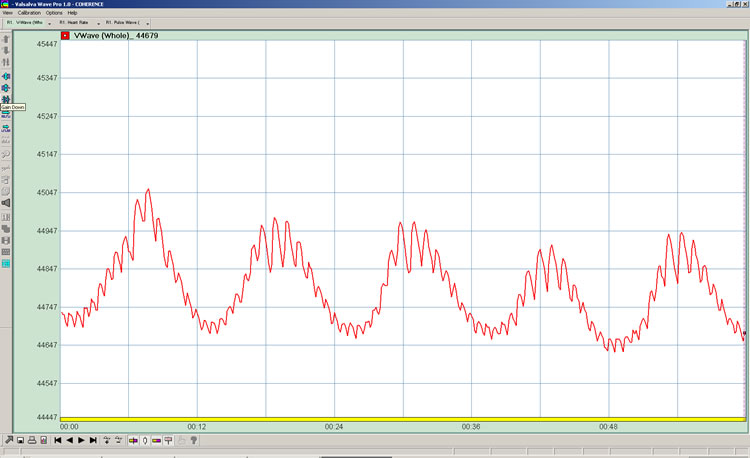
A. The Whole Valsalva Wave:
The whole Valsalva Wave is the complex output of the DC plethysmograph, demonstrating dynamic blood volume as a function of respiration, heart beat, and autonomic governance of vascular capacity. It is the basic signal from which we derive the Valsalva Wave, the AC Pulse Wave, and the Heart Rate. Generally, the whole Valsalva Wave rises with exhalation and falls with inhalation. |
B. The Fast Valsalva Wave:
The fast Valsalva Wave is derived by measuring the whole Valsalva Wave during each inter-beat interval and averaging the output over 10 measurement samples. Generally, the Valsalva Wave rises with exhalation and falls with inhalation. Other V-Wave signals are derived from this signal. See the "Valsalva Wave" tab for more information. |
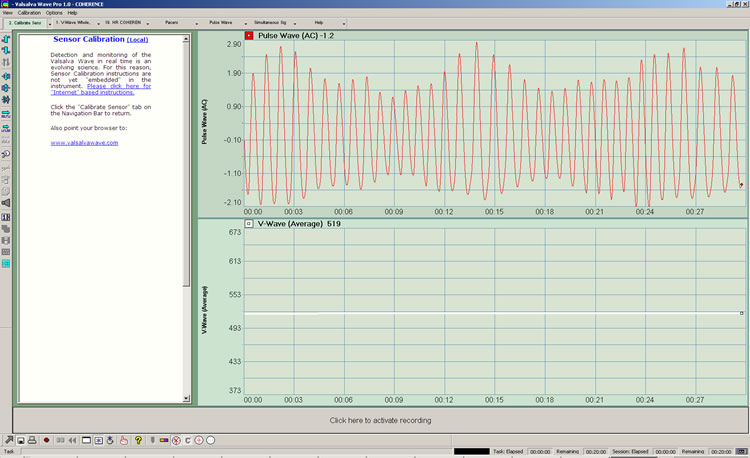
C. The AC Pulse Wave:
The AC Pulse Wave is derived by applying a high pass filter to the whole Valsalva Wave, eliminating the low frequency components having to do with respiration. This leaves an "AC coupled" signal that varies equally around an X axis of zero. This signal is ideal for measuring the "inter-beat interval" from which instantaneous Heart Rate is determined. See the "Pulse Wave" tab for a more complete explanation. |
D. The Fast Heart Rate:
When the inter-beat interval is divided into 60 seconds it yields instantaneous heart rate in "beats per minute". When heart rate is plotted it yields the signal we know as heart rate variability or "HRV". HRV is a measure of the extent to which the heart beat rate varies. Generally, Heart Rate rises with inhalation and falls with exhalation. Other Heart Rate signals are derived from this signal. See the "Heart Rate" tab for a more complete explanation. |
| |
|
2. Valsalva Wave Metrics: See description of each graph below.
Valsalva Wave Metrics
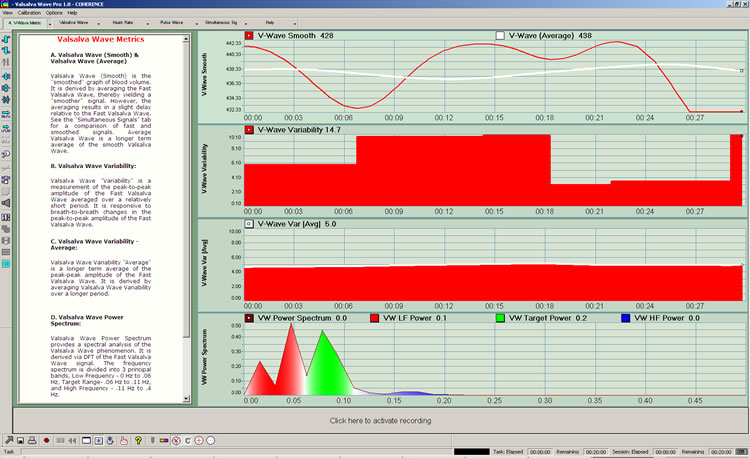
A. Valsalva Wave (Smooth) & Valsalva Wave (Average)
Valsalva Wave (Smooth) is the "smoothed" graph of blood volume. It is derived by averaging the Fast Valsalva Wave, thereby yielding a "smoother" signal. However, the averaging results in a slight delay relative to the Fast Valsalva Wave. See the "Simultaneous Signals" tab for a comparison of fast and smoothed signals. Average Valsalva Wave is a longer term average of the smooth Valsalva Wave. |
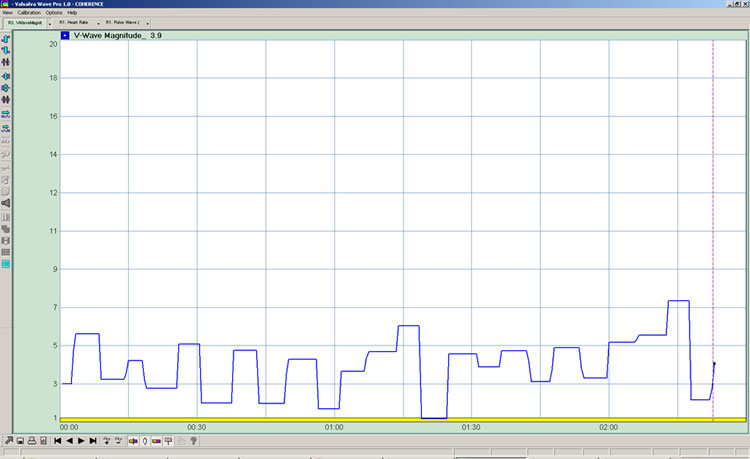
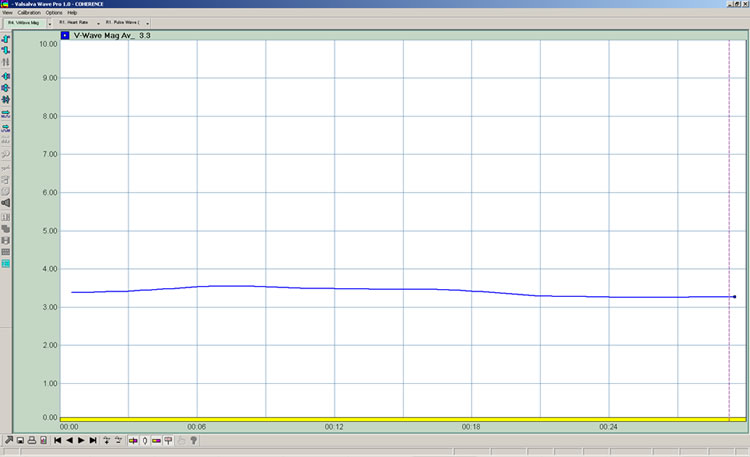
B. Valsalva Wave Magnitude:
Valsalva Wave "magnitude" is a measurement of the peak-to-peak amplitude of the Fast Valsalva Wave averaged over a relatively short period. It is responsive to breath-to-breath changes in the peak-to-peak amplitude of the Valsalva Wave. |
C. Valsalva Wave Magnitude - Average:
Valsalva Wave Magnitude "Average" is a longer term average of the peak-peak amplitude of the Valsalva Wave. It is derived by averaging Valsalva Wave Magnitude over a large number of samples. |
D. Valsalva Wave Power Spectrum:
Valsalva Wave Power Spectrum provides a spectral analysis of the Valsalva Wave phenomenon. It is derived via FFT of the Fast Valsalva Wave signal. The frequency spectrum is divided into 3 principal bands, Low Frequency - 0 Hz to .06 Hz, Mid Range - .06 Hz to .11 Hz, and High Frequency - .11 Hz to .4 Hz. |
| |
|
3. Heart Rate Metrics: See description of each graph below.
Heart Rate Metrics
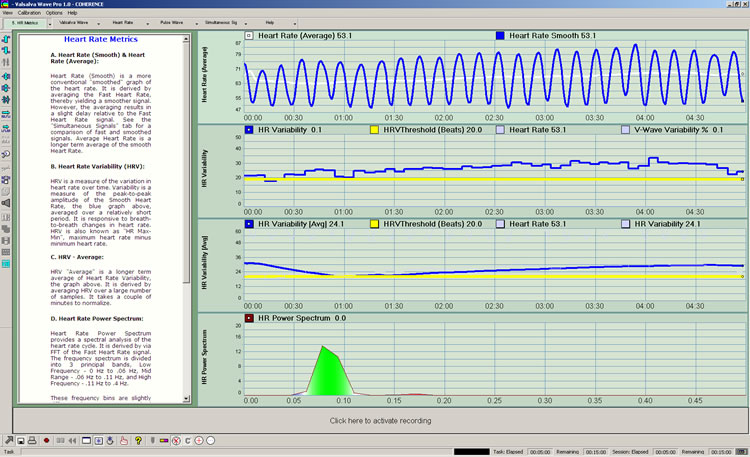
A. Heart Rate (Smooth) & Heart Rate (Average):
Heart Rate (Smooth) is a more conventional "smoothed" graph of the heart rate. It is derived by averaging the Fast Heart Rate, thereby yielding a smoother signal. However, the averaging results in a slight delay relative to the Fast Heart Rate signal. See the "Simultaneous Signals" tab for a comparison of fast and smoothed signals. Average Heart Rate is a longer term average of the smooth Heart Rate. |
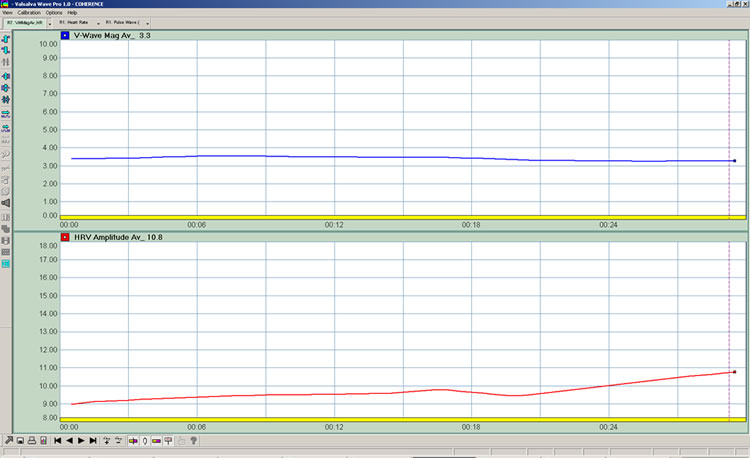
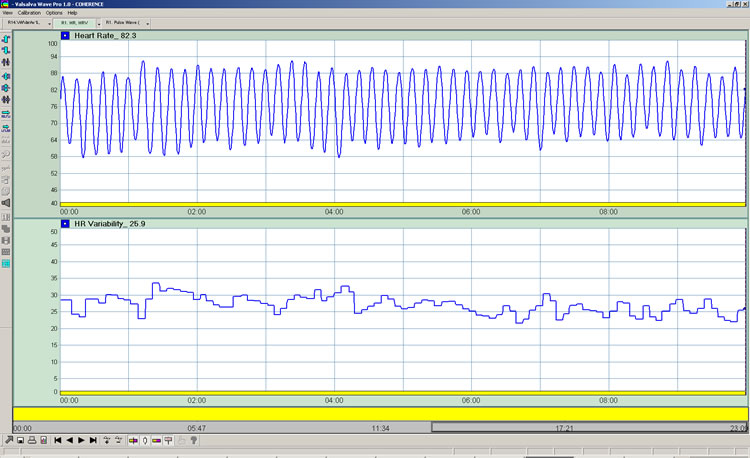
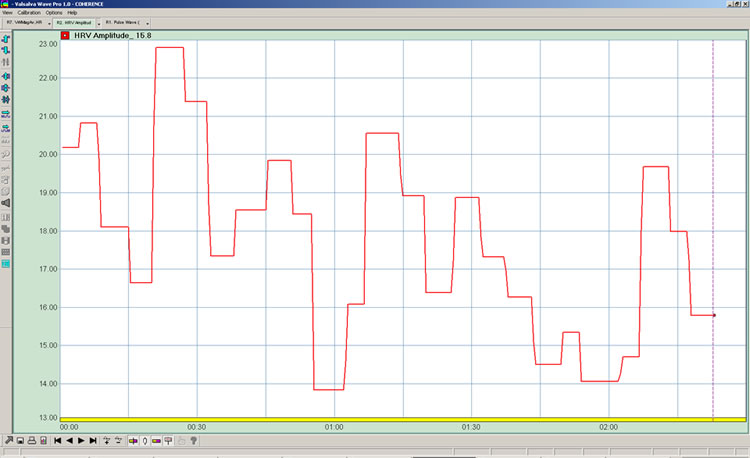
B. Heart Rate Variability (HRV) Amplitude:
HRV Amplitude is a measurement of the peak- to-peak amplitude of the Fast Heart Rate averaged over a relatively short period. It is responsive to breath-to-breath changes in the peak-to-peak amplitude of the HRV cycle. HRV Amplitude is also known as "maximum heart rate minus minimum heart rate". |
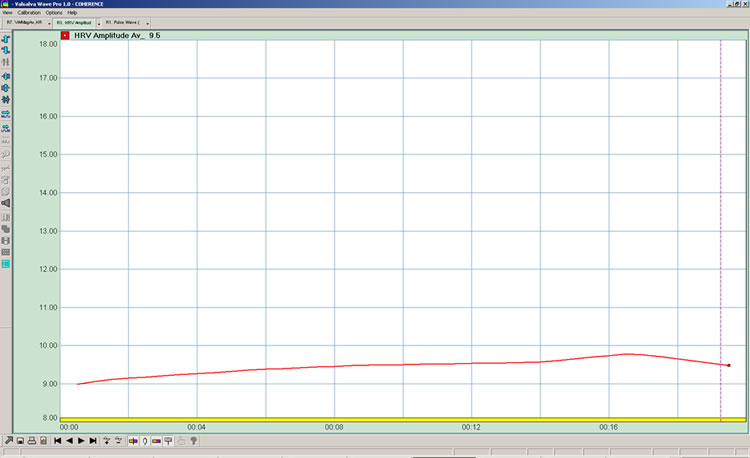
C. HRV Amplitude - Average:
HRV Amplitude "Average" is a longer term average of the peak-peak amplitude of the HRV cycle. It is derived by averaging HRV Amplitude over a large number of samples. |
D. Heart Rate Power Spectrum:
HR Power Spectrum provides a spectral analysis of the heart beat rate. It is derived by via FFT of the Fast Heart Rate signal.The frequency spectrum is divided into 3 principal bands, Low Frequency - 0 Hz to .06 Hz, Mid Range - .06 Hz to .11 Hz, and High Frequency - .11 Hz to .4 Hz. |
| |
|
4. Amp & Sensor:
The Amp And Sensor (Internet)
Click here for more information about The Amp and Sensor or point your browser to: www.valsalvawave.com/valsalvawavehelp.html (right click and choose "Open In New Window")
Valsalva Wave "hardware" consists of an "Amplifier" and a plethysmographic "Sensor". The sensor detects blood volume/density as a function of blood flow and pressure. The amplifier amplifies, conditions, and digitizes the signal, as well as providing Universal Serial Bus (USB) interfacing with a Windows PC.
Caution: Please Read This Carefully!
Valsalva Wave Pro supports two different Amp/Sensor combinations, 1 for the finger and 1 for the ear. Please note that the Sensors are not interchangeable! If you plug an ear Sensor into a finger AMP, or a finger Sensor into an ear Amp, either the Amp or the Sensor may be damaged permanently.
Amps and Sensors are color coded to help remind the user that they are not interchangeable.
|
Regarding general use, Valsalva Wave Pro depends on the presence of the Amplifier and Sensor. If the Amplifier is unplugged from the PC when the application is running, the application will be interrupted. Also, if the Sensor is plugged into the Amplifier or unplugged from the Amplifier while the application is running, the application will be interrupted. It is best to plug the Sensor into the Amplifier, then plug the Amplifier into the USB port on the computer, then open the application. Follow this same process in reverse for unplugging the Amplifier and Sensor.
Please visit: www.valsalvawave.com/valsalvawavehelp.html for additional information about the Amplifier and Sensor.
5. Sensor Calibration:
Detection and monitoring of the Valsalva Wave in real time is an evolving science. For this reason, Sensor Calibration instructions are not yet "embedded" in the instrument. Please click here for "Internet" based instructions.
Click the "Calibrate Sensor" tab on the Navigation Bar to return.
6. Reports: This selection explains the reports provided. When a session is recorded, Valsalva Wave Pro records the data associated with any or all signals. Afterwards, the session can be selected and the data can be viewed or exported. The following reports are those automatically generated in Version 1.0. Data is available for all signals for purposes of exporting. Instructions for viewing and generating reports can be found under the Help menu.
Note: All screens can be paused and "screen printed" at any time by clicking the "Freeze Screen" icon  on the bottom "Control Bar". You can print the screen by clicking the "Print Screen" icon on the bottom "Control Bar". You can print the screen by clicking the "Print Screen" icon  or simply freeze the screen and use the PC print screen function. You might then past the screen image into another application for safe keeping. or simply freeze the screen and use the PC print screen function. You might then past the screen image into another application for safe keeping.
Valslava Wave Report Series
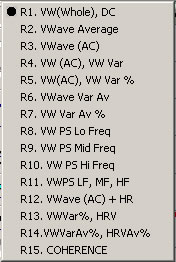
R1. Valsalva Wave (Whole)
R2. Valsalva Wave (AC)

R3. Valsalva Wave Magnitude
R4. Valsalva Wave Magnitude (Average)
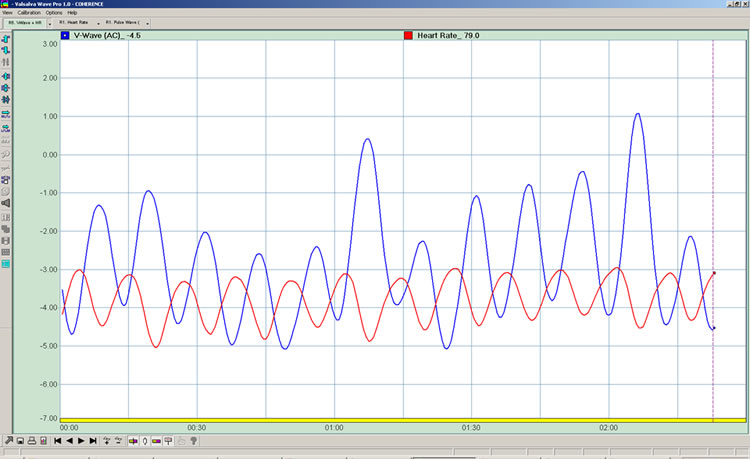
R5. Valsalva Wave (AC) AND Heart Rate Smooth
R6. Valsalva Wave Magnitude, Heart Rate Variability Amplitude
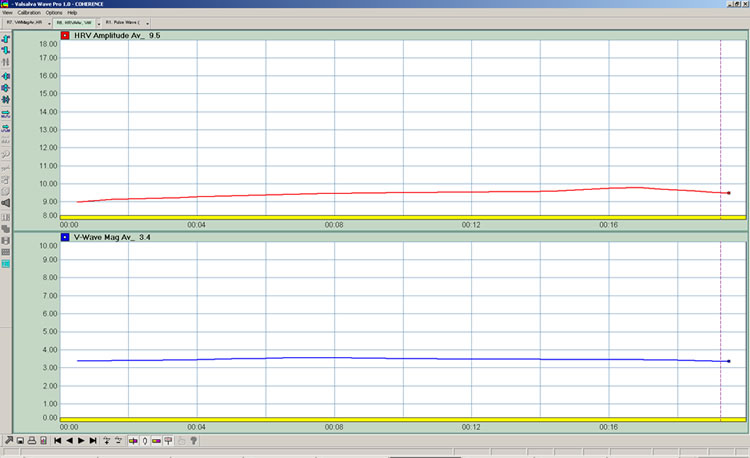
R7. Valsalva Wave Magnitude (Average), Heart Rate Variability Amplitude (Average)
Heart Rate Reports Series
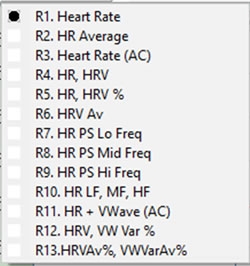
R1. Heart Rate
R2. Heart Rate Variability Amplitude
R3. Heart Rate Variability Amplitude (Average)
R4. Heart Rate Smooth AND Valsalva Wave (AC)
.jpg)
R5. 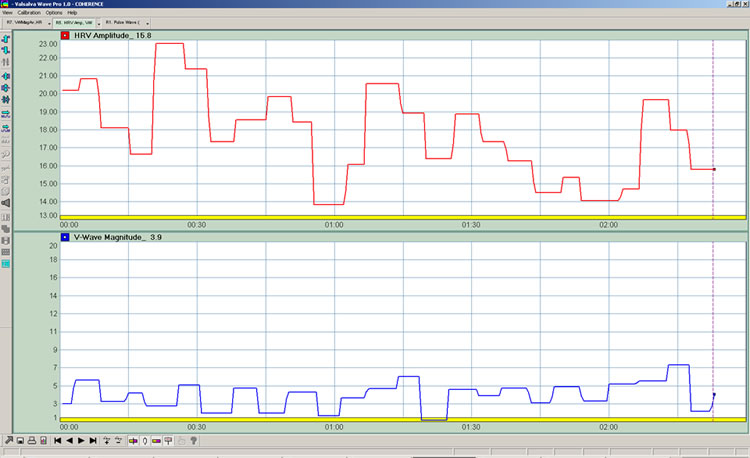
R6. Heart Rate Variability Amplitude (Average), Valsalva Wave Magnitude (Average)
Patent Pending
Copyright 2009, COHERENCE LLC
|